8.1_圆角热图/01_round_corner_heatmap.r
r · 13339 bytes
#!/usr/bin/env Rscript
# ============================================================================
# 01_round_corner_heatmap.R
#
# ComplexHeatmap 圆角热图可复用模板。
# 输入:第一列为行名、其余列为数值的 CSV;可选 feature-group CSV/TSV。
# 输出:只输出矢量 PDF。
#
# 行 = 细胞亚群/样本/比较单位,列 = 基因/通路/其他特征。
# 原教程的 scale(data) 是按列标准化,因此 --scale 的默认值为 column。
# ============================================================================

suppressPackageStartupMessages({
  if (!requireNamespace("ComplexHeatmap", quietly = TRUE)) {
    stop("缺少 ComplexHeatmap;请先运行 BiocManager::install('ComplexHeatmap')。")
  }
  if (!requireNamespace("circlize", quietly = TRUE)) {
    stop("缺少 circlize;请先运行 install.packages('circlize')。")
  }
})

args <- commandArgs(trailingOnly = TRUE)

arg_value <- function(key, default = NULL) {
  flag <- paste0("--", key)
  exact <- which(args == flag)
  if (length(exact) > 0L) {
    pos <- exact[1]
    if (pos == length(args)) stop(flag, " 后缺少参数值。")
    return(args[pos + 1L])
  }
  prefix <- paste0(flag, "=")
  inline <- grep(paste0("^", prefix), args, value = TRUE)
  if (length(inline) > 0L) return(sub(prefix, "", inline[1]))
  default
}

show_help <- function() {
  cat(paste0(
    "用法:Rscript 01_round_corner_heatmap.R [选项]\n\n",
    "选项:\n",
    "  --input FILE       表达矩阵 CSV;省略时使用内置演示矩阵\n",
    "  --groups FILE      feature,group[,label,color] 映射 CSV/TSV\n",
    "  --variant NAME     clustered | rounded | grouped | all(默认 grouped)\n",
    "  --scale NAME       column | row | none(默认 column)\n",
    "  --group_size N     未提供 --groups 时每组的相邻列数(默认 3)\n",
    "  --out FILE         输出 PDF(默认 output/round_corner_heatmap.pdf)\n",
    "  --cell_cm N        单元格边长,单位 cm(默认 0.6)\n",
    "  --width_cm N       PDF 宽度,单位 cm;省略时按矩阵列数估算\n",
    "  --height_cm N      PDF 高度,单位 cm;省略时按矩阵行数估算\n",
    "  --help             显示本帮助\n\n",
    "示例:\n",
    "  Rscript 01_round_corner_heatmap.R --variant grouped --out output/demo.pdf\n",
    "  Rscript 01_round_corner_heatmap.R --input expr.csv --groups groups.csv --out output/my_heatmap.pdf\n"
  ))
}

if (any(c("--help", "-h") %in% args)) {
  show_help()
  quit(save = "no", status = 0L)
}

parse_positive <- function(x, name, integer = FALSE) {
  value <- suppressWarnings(as.numeric(x))
  if (length(value) != 1L || is.na(value) || !is.finite(value) || value <= 0) {
    stop(name, " 必须是正数,当前为:", x)
  }
  if (integer && value != as.integer(value)) stop(name, " 必须是整数,当前为:", x)
  if (integer) as.integer(value) else value
}

input_csv <- arg_value("input", NA_character_)
groups_csv <- arg_value("groups", NA_character_)
variant <- arg_value("variant", "grouped")
scale_mode <- arg_value("scale", "column")
group_size <- parse_positive(arg_value("group_size", "3"), "group_size", integer = TRUE)
cell_size_cm <- parse_positive(arg_value("cell_cm", "0.6"), "cell_cm")
out_pdf <- arg_value("out", "output/round_corner_heatmap.pdf")
width_arg <- arg_value("width_cm", NA_character_)
height_arg <- arg_value("height_cm", NA_character_)

variant <- match.arg(variant, c("clustered", "rounded", "grouped", "all"))
scale_mode <- match.arg(scale_mode, c("column", "row", "none"))
if (!grepl("\\.pdf$", out_pdf, ignore.case = TRUE)) {
  stop("--out 必须以 .pdf 结尾;本仓库科研图只输出 PDF。")
}

read_expression_csv <- function(path) {
  if (!file.exists(path)) stop("找不到输入矩阵:", path)
  raw <- tryCatch(
    utils::read.csv(path, row.names = 1, check.names = FALSE,
                    stringsAsFactors = FALSE),
    error = function(e) stop("读取表达矩阵失败:", conditionMessage(e))
  )
  if (nrow(raw) < 1L || ncol(raw) < 1L) stop("表达矩阵至少需要 1 行和 1 列数值。")
  if (is.null(rownames(raw)) || anyNA(rownames(raw)) || any(trimws(rownames(raw)) == "")) {
    stop("表达矩阵第一列必须提供非空行名。")
  }
  if (anyDuplicated(rownames(raw))) stop("表达矩阵行名不能重复。")
  if (is.null(colnames(raw)) || anyNA(colnames(raw)) || any(trimws(colnames(raw)) == "")) {
    stop("表达矩阵列名不能有空值。")
  }
  if (anyDuplicated(colnames(raw))) stop("表达矩阵列名不能重复。")

  numeric_columns <- lapply(raw, function(x) suppressWarnings(as.numeric(x)))
  bad_columns <- names(numeric_columns)[vapply(numeric_columns, function(x) anyNA(x), logical(1))]
  if (length(bad_columns) > 0L) {
    stop("以下列无法转换为完整数值:", paste(bad_columns, collapse = ", "))
  }
  mat <- do.call(cbind, numeric_columns)
  dimnames(mat) <- dimnames(raw)
  if (any(!is.finite(mat))) stop("表达矩阵不能含 Inf 或 -Inf。")
  mat
}

demo_matrix <- function(seed = 20260901L) {
  set.seed(seed)
  row_labels <- c(
    "T cell", "B cell", "Macrophage", "Fibroblast", "Endothelial",
    "Keratinocyte", "NK cell", "Dendritic", "Mast cell"
  )
  feature_labels <- c(
    "KRT10", "KRT14", "KRT5", "COL1A1", "COL3A1", "DCN", "VWF", "PECAM1", "KDR",
    "LYZ", "CTSS", "FCER1G", "CD3D", "CD3E", "IL7R", "MS4A1", "CD79A", "CD37",
    "NKG7", "GNLY", "TRBC2", "TPSAB1", "KIT", "MS4A2", "CXCL10", "CCL14", "MKI67"
  )
  mat <- matrix(rnorm(length(row_labels) * length(feature_labels), sd = 0.42),
                nrow = length(row_labels), dimnames = list(row_labels, feature_labels))
  row_effect <- seq(-1.1, 1.1, length.out = length(row_labels))
  mat[, 1:3] <- mat[, 1:3] + row_effect
  mat[, 4:6] <- mat[, 4:6] - rev(row_effect)
  mat[, 7:9] <- mat[, 7:9] + sin(seq_along(row_effect))
  mat[, 10:12] <- mat[, 10:12] + cos(seq_along(row_effect))
  mat[, 19:21] <- mat[, 19:21] + rev(row_effect) / 1.5
  mat
}

z_score <- function(x) {
  center <- mean(x)
  spread <- stats::sd(x)
  if (!is.finite(spread) || spread == 0) return(rep(0, length(x)))
  (x - center) / spread
}

scale_matrix <- function(mat, mode = c("column", "row", "none")) {
  mode <- match.arg(mode)
  if (mode == "none") return(mat)
  scaled <- if (mode == "column") {
    vapply(seq_len(ncol(mat)), function(j) z_score(mat[, j]), numeric(nrow(mat)))
  } else {
    t(vapply(seq_len(nrow(mat)), function(i) z_score(mat[i, ]), numeric(ncol(mat))))
  }
  dimnames(scaled) <- dimnames(mat)
  scaled
}

default_group_colors <- function(n) {
  base <- c(
    "#D2749B", "#F89C54", "#F8AD20", "#E8C559", "#FDDB50",
    "#E3E592", "#93CC82", "#9FD9DC", "#A1D4F0", "#C7C2E1"
  )
  if (n <= length(base)) return(base[seq_len(n)])
  grDevices::hcl.colors(n, palette = "Dynamic")
}

validate_hex <- function(x, label) {
  if (length(x) != 1L || is.na(x) || !grepl("^#[0-9A-Fa-f]{6}$", x)) {
    stop(label, " 必须是 #RRGGBB 颜色,当前为:", x)
  }
}

make_default_groups <- function(feature_names, group_size) {
  group <- ceiling(seq_along(feature_names) / group_size)
  levels <- unique(group)
  list(
    groups = as.character(group),
    levels = as.character(levels),
    labels = paste("Group", levels),
    colors = default_group_colors(length(levels))
  )
}

read_group_map <- function(path, feature_names) {
  if (!file.exists(path)) stop("找不到分组映射文件:", path)
  reader <- if (grepl("\\.tsv$", path, ignore.case = TRUE)) utils::read.delim else utils::read.csv
  map <- tryCatch(
    reader(path, check.names = FALSE, stringsAsFactors = FALSE),
    error = function(e) stop("读取分组映射失败:", conditionMessage(e))
  )
  required <- c("feature", "group")
  missing <- setdiff(required, names(map))
  if (length(missing) > 0L) stop("分组映射缺少列:", paste(missing, collapse = ", "))
  if (anyDuplicated(as.character(map$feature))) stop("分组映射中的 feature 不能重复。")
  position <- match(feature_names, as.character(map$feature))
  if (anyNA(position)) {
    stop("分组映射缺少这些表达矩阵列:", paste(feature_names[is.na(position)], collapse = ", "))
  }
  map <- map[position, , drop = FALSE]
  group <- trimws(as.character(map$group))
  if (anyNA(group) || any(group == "")) stop("分组映射的 group 不能有空值。")
  levels <- unique(group)

  labels <- vapply(levels, function(g) {
    values <- if ("label" %in% names(map)) unique(trimws(as.character(map$label[group == g]))) else character()
    values <- values[!is.na(values) & values != ""]
    if (length(values) > 1L) stop("同一 group 的 label 不一致:", g)
    if (length(values) == 0L) g else values[1]
  }, character(1))

  colors <- vapply(seq_along(levels), function(i) {
    g <- levels[i]
    values <- if ("color" %in% names(map)) unique(trimws(as.character(map$color[group == g]))) else character()
    values <- values[!is.na(values) & values != ""]
    if (length(values) > 1L) stop("同一 group 的 color 不一致:", g)
    if (length(values) == 0L) default_group_colors(length(levels))[i] else values[1]
  }, character(1))
  for (i in seq_along(colors)) validate_hex(colors[i], paste0("group ", levels[i], " 的 color"))

  list(groups = group, levels = levels, labels = labels, colors = colors)
}

make_color_fun <- function(mat, palette = c("#B3A9EB", "white", "#FFA500")) {
  limit <- max(abs(mat), na.rm = TRUE)
  if (!is.finite(limit) || limit == 0) limit <- 1
  circlize::colorRamp2(c(-limit, 0, limit), palette, transparency = 0.12)
}

round_cell <- function(j, i, x, y, width, height, fill) {
  grid::grid.roundrect(
    x = x,
    y = y,
    width = width * 0.88,
    height = height * 0.88,
    r = grid::unit(0.20, "snpc"),
    gp = grid::gpar(col = "white", fill = fill, lwd = 0.9)
  )
}

build_heatmap <- function(mat, variant, group_info = NULL, cell_size_cm = 0.6,
                          scale_mode = "column") {
  legend_title <- if (scale_mode == "none") "Expression" else "Z-score"
  common <- list(
    matrix = mat,
    name = legend_title,
    col = make_color_fun(mat),
    width = grid::unit(ncol(mat) * cell_size_cm, "cm"),
    height = grid::unit(nrow(mat) * cell_size_cm, "cm"),
    use_raster = FALSE,
    row_names_side = "left",
    row_names_gp = grid::gpar(fontsize = 7),
    column_names_gp = grid::gpar(fontsize = 7),
    column_names_rot = 45,
    heatmap_legend_param = list(
      title = legend_title,
      title_gp = grid::gpar(fontsize = 9),
      labels_gp = grid::gpar(fontsize = 7)
    )
  )

  if (variant == "clustered") {
    return(do.call(ComplexHeatmap::Heatmap, c(common, list(
      rect_gp = grid::gpar(col = "white", lwd = 1.2),
      cluster_rows = TRUE,
      cluster_columns = TRUE
    ))))
  }

  rounded_args <- list(
    cell_fun = round_cell,
    rect_gp = grid::gpar(type = "none"),
    cluster_rows = FALSE,
    cluster_columns = FALSE
  )
  if (variant == "grouped") {
    if (is.null(group_info)) stop("grouped 模式需要 group_info。")
    group_factor <- factor(group_info$groups, levels = group_info$levels)
    rounded_args$column_split <- group_factor
    rounded_args$column_title <- NULL
    rounded_args$top_annotation <- ComplexHeatmap::HeatmapAnnotation(
      Group = ComplexHeatmap::anno_block(
        gp = grid::gpar(fill = group_info$colors, col = "white"),
        labels = group_info$labels,
        labels_gp = grid::gpar(col = "black", fontsize = 7)
      ),
      show_annotation_name = FALSE,
      height = grid::unit(0.35, "cm")
    )
  }
  do.call(ComplexHeatmap::Heatmap, c(common, rounded_args))
}

write_heatmap_pdf <- function(ht, path, width_cm, height_cm) {
  dir.create(dirname(path), showWarnings = FALSE, recursive = TRUE)
  grDevices::pdf(path, width = width_cm / 2.54, height = height_cm / 2.54,
                 useDingbats = FALSE)
  on.exit(grDevices::dev.off(), add = TRUE)
  ComplexHeatmap::draw(
    ht,
    padding = grid::unit(c(3, 3, 3, 3), "mm"),
    merge_legends = TRUE
  )
  invisible(path)
}

mat_raw <- if (is.na(input_csv)) demo_matrix() else read_expression_csv(input_csv)
mat <- scale_matrix(mat_raw, scale_mode)
group_info <- NULL
if (variant %in% c("grouped", "all")) {
  group_info <- if (is.na(groups_csv)) {
    make_default_groups(colnames(mat), group_size)
  } else {
    read_group_map(groups_csv, colnames(mat))
  }
}

width_cm <- if (is.na(width_arg)) max(8, ncol(mat) * cell_size_cm + 4) else parse_positive(width_arg, "width_cm")
height_cm <- if (is.na(height_arg)) max(6, nrow(mat) * cell_size_cm + 3) else parse_positive(height_arg, "height_cm")

variants <- if (variant == "all") c("clustered", "rounded", "grouped") else variant
output_paths <- if (length(variants) == 1L) {
  out_pdf
} else {
  stem <- sub("\\.pdf$", "", out_pdf, ignore.case = TRUE)
  paste0(stem, "_", variants, ".pdf")
}

cat(sprintf("矩阵:%d 行 × %d 列;scale=%s;variant=%s\n",
            nrow(mat), ncol(mat), scale_mode, variant))
for (i in seq_along(variants)) {
  current <- variants[i]
  ht <- build_heatmap(
    mat = mat,
    variant = current,
    group_info = group_info,
    cell_size_cm = cell_size_cm,
    scale_mode = scale_mode
  )
  write_heatmap_pdf(ht, output_paths[i], width_cm, height_cm)
  cat("PDF 输出:", output_paths[i], "\n")
}
cat("ROUND_HEATMAP_OK\n")
8.2_基因分组表达环状热图/01_circular_gene_group_heatmap.r
r · 15483 bytes
#!/usr/bin/env Rscript
# ============================================================================
# 01_circular_gene_group_heatmap.R
#
# Cell (2024) Figure 6H 风格:分组环状表达热图 + qvalue 菱形点图 +
# 中心 Euler/Venn 图。脚本只输出 PDF,不带入文章数据或原图。
#
# 输入:
#   Group, Gene, qval,以及五个表达/评分列(默认使用教程中的心脏部位名)。
#   支持 .xlsx/.xls 和 .csv。
# 输出:矢量 PDF。
# ============================================================================

suppressPackageStartupMessages({
  required <- c("circlize", "ComplexHeatmap", "eulerr", "readxl", "scales", "RColorBrewer")
  missing <- required[!vapply(required, requireNamespace, logical(1), quietly = TRUE)]
  if (length(missing) > 0L) {
    stop("缺少 R 包:", paste(missing, collapse = ", "),
         ";请参照 README.md 安装。", call. = FALSE)
  }
})

args <- commandArgs(trailingOnly = TRUE)

arg_value <- function(key, default = NULL) {
  flag <- paste0("--", key)
  exact <- which(args == flag)
  if (length(exact) > 0L) {
    pos <- exact[1]
    if (pos == length(args)) stop(flag, " 后缺少参数值。", call. = FALSE)
    return(args[pos + 1L])
  }
  prefix <- paste0(flag, "=")
  inline <- grep(paste0("^", prefix), args, value = TRUE)
  if (length(inline) > 0L) return(sub(prefix, "", inline[1]))
  default
}

show_help <- function() {
  cat(paste0(
    "用法:Rscript 01_circular_gene_group_heatmap.R [选项]\n\n",
    "  --input FILE          输入 .xlsx/.xls/.csv;省略时使用演示数据\n",
    "  --out FILE            输出 PDF(默认 output/circular_gene_group_heatmap.pdf)\n",
    "  --regions A,B,C,D,E   五个表达列名(默认教程中的心脏部位)\n",
    "  --group_order A,B,C   三个分组的显示顺序\n",
    "  --qval_mode NAME      source | significance(默认 source)\n",
    "  --start_degree N      环图起始角度(默认 60)\n",
    "  --gap_small N         前两个扇区间隙(默认 5)\n",
    "  --gap_large N         最后一个扇区间隙(默认 30)\n",
    "  --cell_cm N           PDF 边长,单位 cm(默认 20)\n",
    "  --heatmap_track N     热图轨道高度(默认 0.25)\n",
    "  --help                显示本帮助\n\n",
    "示例:\n",
    "  Rscript 01_circular_gene_group_heatmap.R --input data.xlsx \\\n",
    "    --qval_mode significance --out output/figure6h.pdf\n"
  ))
}

if (any(c("--help", "-h") %in% args)) {
  show_help()
  quit(save = "no", status = 0L)
}

parse_positive <- function(x, name) {
  value <- suppressWarnings(as.numeric(x))
  if (length(value) != 1L || is.na(value) || !is.finite(value) || value <= 0) {
    stop(name, " 必须是正数,当前为:", x, call. = FALSE)
  }
  value
}

parse_vector <- function(x, name, expected = NULL) {
  values <- trimws(strsplit(x, ",", fixed = TRUE)[[1]])
  values <- values[nzchar(values)]
  if (length(values) == 0L || (!is.null(expected) && length(values) != expected)) {
    suffix <- if (is.null(expected)) "" else paste0("(需要 ", expected, " 个值)")
    stop(name, " 不能为空", suffix, call. = FALSE)
  }
  if (anyDuplicated(values)) stop(name, " 不能含重复值。", call. = FALSE)
  values
}

input_path <- arg_value("input", NA_character_)
out_pdf <- arg_value("out", "output/circular_gene_group_heatmap.pdf")
regions <- parse_vector(
  arg_value("regions", "Left atrium,Right atrium,Outflow tract,Right ventricle,Left ventricle"),
  "regions", expected = 5L
)
group_order_arg <- arg_value("group_order", NA_character_)
group_order <- if (is.na(group_order_arg)) {
  c("Divergence", "Curl", "Acceleration")
} else {
  parse_vector(group_order_arg, "group_order", expected = 3L)
}
qval_mode <- match.arg(arg_value("qval_mode", "source"), c("source", "significance"))
start_degree <- parse_positive(arg_value("start_degree", "60"), "start_degree")
gap_small <- parse_positive(arg_value("gap_small", "5"), "gap_small")
gap_large <- parse_positive(arg_value("gap_large", "30"), "gap_large")
cell_cm <- parse_positive(arg_value("cell_cm", "20"), "cell_cm")
heatmap_track <- parse_positive(arg_value("heatmap_track", "0.25"), "heatmap_track")
if (!grepl("\\.pdf$", out_pdf, ignore.case = TRUE)) {
  stop("--out 必须以 .pdf 结尾;本仓库科研图只输出 PDF。", call. = FALSE)
}

demo_data <- function(seed = 20260901L) {
  set.seed(seed)
  gene_sets <- list(
    Divergence = sprintf("DVG%02d", 1:12),
    Curl = c(sprintf("DVG%02d", 7:10), sprintf("CRL%02d", 1:8)),
    Acceleration = c(sprintf("DVG%02d", 10:12), sprintf("CRL%02d", 6:8), sprintf("ACC%02d", 1:9))
  )
  rows <- do.call(rbind, lapply(names(gene_sets), function(g) {
    genes <- gene_sets[[g]]
    values <- matrix(runif(length(genes) * 5, min = 0.05, max = 8), ncol = 5)
    colnames(values) <- c("Left atrium", "Right atrium", "Outflow tract", "Right ventricle", "Left ventricle")
    data.frame(Group = g, Gene = genes,
               qval = 10^(-runif(length(genes), min = 2, max = 5)),
               values, check.names = FALSE, stringsAsFactors = FALSE)
  }))
  rows
}

read_input <- function(path) {
  if (is.na(path)) return(demo_data())
  if (!file.exists(path)) stop("找不到输入文件:", path, call. = FALSE)
  ext <- tolower(tools::file_ext(path))
  out <- if (ext %in% c("xlsx", "xls")) {
    readxl::read_excel(path)
  } else if (ext == "csv") {
    utils::read.csv(path, check.names = FALSE, stringsAsFactors = FALSE)
  } else {
    stop("--input 只支持 .xlsx/.xls/.csv,当前为:", path, call. = FALSE)
  }
  as.data.frame(out, check.names = FALSE, stringsAsFactors = FALSE)
}

rename_alias <- function(data, target, aliases) {
  if (target %in% names(data)) return(data)
  hit <- aliases[aliases %in% names(data)]
  if (length(hit) > 0L) names(data)[match(hit[1], names(data))] <- target
  data
}

rescale_group <- function(x, index) {
  out <- numeric(length(x))
  for (idx in split(seq_along(x), index, drop = TRUE)) {
    values <- x[idx]
    limits <- range(values)
    out[idx] <- if (diff(limits) == 0) 0.25 else scales::rescale(values, to = c(0, 0.5))
  }
  out
}

prepare_data <- function(data, regions, group_order) {
  data <- rename_alias(data, "Group", c("group", "GROUP"))
  data <- rename_alias(data, "Gene", c("gene", "GENE"))
  data <- rename_alias(data, "qval", c("qvalue", "q_value", "Qval", "Qvalue"))
  required <- c("Group", "Gene", "qval", regions)
  missing <- setdiff(required, names(data))
  if (length(missing) > 0L) stop("输入缺少列:", paste(missing, collapse = ", "), call. = FALSE)

  data$Group <- trimws(as.character(data$Group))
  data$Gene <- trimws(as.character(data$Gene))
  data$qval <- suppressWarnings(as.numeric(data$qval))
  if (anyNA(data$Group) || any(data$Group == "")) stop("Group 不能含空值。", call. = FALSE)
  if (anyNA(data$Gene) || any(data$Gene == "")) stop("Gene 不能含空值。", call. = FALSE)
  if (anyNA(data$qval) || any(!is.finite(data$qval)) || any(data$qval < 0 | data$qval > 1)) {
    stop("qval 必须是 0 到 1 之间的有限数值。", call. = FALSE)
  }
  if (length(unique(data$Group)) != 3L) {
    stop("当前模板要求恰好 3 个 Group,检测到:", paste(unique(data$Group), collapse = ", "), call. = FALSE)
  }
  if (!setequal(unique(data$Group), group_order)) {
    stop("group_order 必须恰好包含输入中的三个 Group。输入为:",
         paste(unique(data$Group), collapse = ", "), call. = FALSE)
  }
  if (anyDuplicated(data[c("Group", "Gene")])) {
    stop("同一 Group 内的 Gene 不能重复;跨 Group 重复是允许的。", call. = FALSE)
  }
  for (region in regions) {
    data[[region]] <- suppressWarnings(as.numeric(data[[region]]))
    if (anyNA(data[[region]]) || any(!is.finite(data[[region]]))) {
      stop("表达列 ", region, " 必须是有限数值。", call. = FALSE)
    }
  }

  data$Group <- factor(data$Group, levels = group_order)
  data <- data[order(data$Group, data$qval, data$Gene), , drop = FALSE]
  for (region in regions) data[[region]] <- rescale_group(data[[region]], data$Group)
  row_labels <- make.unique(as.character(data$Gene), sep = "__")
  expression_matrix <- as.matrix(data[, regions, drop = FALSE])
  storage.mode(expression_matrix) <- "double"
  rownames(expression_matrix) <- row_labels
  list(data = data, matrix = expression_matrix, groups = group_order)
}

make_group_colors <- function(group_order) {
  pi_y_g <- rev(RColorBrewer::brewer.pal(n = 5, name = "PiYG"))
  source_colors <- c(Divergence = pi_y_g[1], Curl = pi_y_g[3], Acceleration = pi_y_g[5])
  fallback <- grDevices::hcl.colors(length(group_order), palette = "Dynamic")
  colors <- setNames(fallback, group_order)
  common <- intersect(group_order, names(source_colors))
  colors[common] <- source_colors[common]
  colors
}

make_qval_scale <- function(qval, mode) {
  palette <- c("#fff1e7", "#f99c70", "#dd4139", "#97044d", "#4f2043", "black")
  at <- seq(0, 1, length.out = length(palette))
  if (mode == "source") {
    score <- pmin(pmax(qval * 100, 0), 1)
    labels <- formatC(at / 100, format = "fg", digits = 3)
    title <- "qval (source)"
  } else {
    qmax <- max(qval, na.rm = TRUE)
    if (!is.finite(qmax) || qmax == 0) qmax <- .Machine$double.eps
    score <- 1 - pmin(pmax(qval / qmax, 0), 1)
    labels <- formatC(qmax * (1 - at), format = "fg", digits = 3)
    title <- "qval (darker = smaller)"
  }
  list(score = score, fun = circlize::colorRamp2(at, palette), at = at,
       labels = labels, title = title)
}

draw_center_venn <- function(gene_sets, colors, label) {
  fit <- eulerr::euler(gene_sets)
  grid::upViewport(0)
  grid::pushViewport(grid::viewport(
    x = 0.5, y = 0.50, width = 0.25, height = 0.25,
    just = c("center", "center"), clip = "off", name = "center_venn"
  ))
  grid::grid.draw(plot(
    fit,
    fills = list(fill = unname(colors), alpha = 0.20),
    edges = list(col = "black", lty = 2, lwd = 1.5),
    labels = FALSE,
    quantities = TRUE
  ))
  grid::grid.text(label, x = 0.5, y = grid::unit(-0.04, "npc"),
                  gp = grid::gpar(fontsize = 10, lineheight = 0.85))
  grid::popViewport()
  invisible(fit)
}

run <- function() {
  raw <- read_input(input_path)
  prepared <- prepare_data(raw, regions, group_order)
  data <- prepared$data
  data_matrix <- prepared$matrix
  groups <- prepared$groups
  group_colors <- make_group_colors(groups)
  expression_col_fun <- circlize::colorRamp2(
    seq(0, 0.5, length.out = 100),
    colorRampPalette(rev(RColorBrewer::brewer.pal(n = 5, name = "PiYG")))(100)
  )
  qval_scale <- make_qval_scale(data$qval, qval_mode)
  qval_colors <- qval_scale$fun(qval_scale$score)
  gene_sets <- lapply(groups, function(g) unique(as.character(data$Gene[data$Group == g])))
  names(gene_sets) <- groups
  venn_colors <- c("#D01C8B", "#4DAC26", "#F7F7F7")[seq_along(groups)]

  dir.create(dirname(out_pdf), showWarnings = FALSE, recursive = TRUE)
  grDevices::pdf(out_pdf, width = cell_cm / 2.54, height = cell_cm / 2.54,
                 useDingbats = FALSE)
  device_open <- TRUE
  on.exit({
    circlize::circos.clear()
    if (device_open) grDevices::dev.off()
  }, add = TRUE)
  circlize::circos.clear()
  circlize::circos.par(
    start.degree = start_degree,
    gap.after = c(rep(gap_small, length(groups) - 1L), gap_large),
    track.margin = c(0, 0.01),
    cell.padding = c(0, 0, 0, 0),
    points.overflow.warning = FALSE
  )

  circlize::circos.heatmap(
    data_matrix,
    split = data$Group,
    cluster = FALSE,
    bg.border = "black",
    bg.lwd = 1,
    cell.border = "white",
    cell.lwd = 0.5,
    rownames.side = "outside",
    rownames.cex = 0.55,
    col = expression_col_fun,
    track.height = heatmap_track
  )
  heatmap_track_index <- circlize::get.current.track.index()

  # 在最后一个扇区外侧标注五个心脏部位。
  circlize::circos.track(
    track.index = heatmap_track_index,
    bg.border = NA,
    panel.fun = function(x, y) {
      if (circlize::CELL_META$sector.numeric.index == length(groups)) {
        n <- ncol(data_matrix)
        cell_height <- (circlize::CELL_META$cell.ylim[2] - circlize::CELL_META$cell.ylim[1]) / n
        y_coords <- seq(
          circlize::CELL_META$cell.ylim[1] + cell_height / 2,
          circlize::CELL_META$cell.ylim[2] - cell_height / 2,
          length.out = n
        )
        for (i in seq_len(n)) {
          circlize::circos.lines(
            c(circlize::CELL_META$cell.xlim[2], circlize::CELL_META$cell.xlim[2] + circlize::convert_x(1, "mm")),
            c(y_coords[i], y_coords[i]), col = "black", lwd = 1.2
          )
        }
        circlize::circos.text(
          rep(circlize::CELL_META$cell.xlim[2] + circlize::convert_x(1.5, "mm"), n),
          y_coords, regions, cex = 0.65, adj = c(0, 0.5), facing = "inside"
        )
      }
    }
  )

  # qvalue 菱形点轨道;每个 Group 内的点顺序与热图行顺序一致。
  circlize::circos.track(
    ylim = c(0, 1), track.height = 0.05, bg.border = NA,
    panel.fun = function(x, y) {
      idx <- which(as.character(data$Group) == circlize::CELL_META$sector.index)
      n <- length(idx)
      x_coords <- circlize::CELL_META$xlim[1] +
        (circlize::CELL_META$xlim[2] - circlize::CELL_META$xlim[1]) * (seq_len(n) - 0.5) / n
      circlize::circos.points(x_coords, rep(0.5, n), pch = 18, cex = 1.25,
                              col = qval_colors[idx])
      if (circlize::CELL_META$sector.numeric.index == length(groups)) {
        circlize::circos.lines(
          c(circlize::CELL_META$cell.xlim[2], circlize::CELL_META$cell.xlim[2] + circlize::convert_x(1, "mm")),
          c(0.5, 0.5), col = "black", lwd = 1.2
        )
        circlize::circos.text(
          circlize::CELL_META$cell.xlim[2] + circlize::convert_x(1.5, "mm"), 0.5,
          "qval", cex = 0.75, adj = c(0, 0.5), facing = "inside"
        )
      }
    }
  )

  circlize::circos.track(
    ylim = c(0, 1), track.height = 0.065,
    bg.col = unname(group_colors[groups]), bg.border = NA,
    panel.fun = function(x, y) {
      circlize::circos.text(
        circlize::CELL_META$xcenter, 0.5, circlize::CELL_META$sector.index,
        facing = "bending.inside", cex = 0.75, adj = c(0.5, 0.5)
      )
    }
  )

  draw_center_venn(gene_sets, venn_colors, "Morphogenic\ngenes")

  heatmap_legend <- ComplexHeatmap::Legend(
    title = "Expression\nfraction", col_fun = expression_col_fun,
    at = seq(0, 0.5, length.out = 6),
    title_position = "leftcenter-rot",
    title_gp = grid::gpar(fontsize = 9), labels_gp = grid::gpar(fontsize = 8)
  )
  qval_legend <- ComplexHeatmap::Legend(
    title = qval_scale$title, col_fun = qval_scale$fun,
    at = qval_scale$at, labels = qval_scale$labels,
    title_position = "leftcenter-rot",
    title_gp = grid::gpar(fontsize = 9), labels_gp = grid::gpar(fontsize = 8)
  )
  grid::upViewport(0)
  ComplexHeatmap::draw(
    heatmap_legend, x = grid::unit(0.97, "npc"), y = grid::unit(0.92, "npc"),
    just = c("right", "top")
  )
  ComplexHeatmap::draw(
    qval_legend, x = grid::unit(0.97, "npc"), y = grid::unit(0.35, "npc"),
    just = c("right", "top")
  )

  circlize::circos.clear()
  grDevices::dev.off()
  device_open <- FALSE
  cat(sprintf("矩阵:%d 行 × %d 列;Group=%s;qval_mode=%s\n",
              nrow(data_matrix), ncol(data_matrix), paste(groups, collapse = ","), qval_mode))
  cat("PDF 输出:", out_pdf, "\n")
  cat("CIRCULAR_GENE_HEATMAP_OK\n")
}

run()
8.1_圆角热图/8.1.1_ggforce版_nature2025蛋白通路/01_原版_script.r
r · 15770 bytes
# ============================================================================
# 01_原版_Script.R —— 原作者 Zenodo 归档原文(仅加本头注,正文未改一字)
#
# 来源:Zenodo 记录 16413641(DOI 10.5281/zenodo.16413641),v2.zip 内的 Script.R
# 论文:Proteotoxic Stress Response Drives T Cell Exhaustion and Immune Evasion
#       Nature 2025-10-01, DOI 10.1038/s41586-025-09539-1(李子海组,Ohio State)
# 获取路径:zenodo.org 本机 HTTPS 不通,经 Software Heritage 归档按 git blob SHA1
#           逐文件取回(swh:1:dir:18d4fb5dec4903836f4543a9c76eae17a5cf997b),
#           11 个文件全部 SHA1 校验一致。
#
# ⚠ 本脚本有若干已知问题,跑之前请先读同目录 README.md「原版踩坑」一节:
#   1. 第 11 行 setwd() 是原作者 Dropbox 绝对路径,必须改成本地路径。
#   2. geom_shape() 的 corner= 与 shape= 参数无效(ggforce 会忽略并 warning);
#      x0/y0 也不是有效 aesthetic。圆角实际只由 radius= 控制。
#   3. pheatmap() 不认 heatmap_legend_param(那是 ComplexHeatmap 的参数),
#      会被 ... 静默吞掉。
#   4. 输入文件 "Supplemental Table S3. Protein expression matrix_Final.xlsx"
#      不在 Zenodo 归档内,需从 Nature 补充材料另取,否则脚本无法跑通。
#   5. sheet 名 "5. MC38.colon " 末尾带一个多余空格,是原作者笔误。
#   6. 归档的成品 PDF 与脚本设置不一致(fig1.h 有行聚类树但脚本写 cluster_rows=FALSE;
#      且其图例显示 Progenitor/Intermediate/Terminal,那是 fig1.j 的分组)。
#
# 可运行的修正版见同目录 02_圆角热图_ggforce模板.R。
# ============================================================================


## Directory Structure:
## - Data
## - Code
## - Results

rm(list=ls())
gc()
set.seed(1111)
setwd("~/BMBL Dropbox/BMBL Project/Weidong-Wu_Projects/Projects/Short/1. [Collaboration] Zihai proteomics [Nature,Long,CO-I]/Second_revision/Zenodo/analysis_code")


# Load the package
library(readxl)
library(tidyverse)
library(dplyr)
library("heatmaply")
library(matrixStats)
library(ggforce)
################# Function Definitions ##########
# ssGSEA (Single-Sample Gene Set Enrichment Analysis)
# Purpose: Calculates enrichment scores for gene sets in individual samples
# Parameters:
#   X: Expression matrix (genes in rows, samples in columns)
#   gene_sets: List of gene sets to analyze
#   alpha: Weight parameter (default 0.25)
#   scale: Whether to scale the results
#   norm: Whether to normalize results
#   single: Use single sample mode
ssgsea = function(X, gene_sets, alpha = 0.25, scale = T, norm = F, single = T) {
  row_names = rownames(X)
  num_genes = nrow(X)
  gene_sets = lapply(gene_sets, function(genes) {which(row_names %in% genes)})

  # Ranks for genes
  R = matrixStats::colRanks(X, preserveShape = T, ties.method = 'average')

  # Calculate enrichment score (es) for each sample (column)
  es = apply(R, 2, function(R_col) {
    gene_ranks = order(R_col, decreasing = TRUE)

    # Calc es for each gene set
    es_sample = sapply(gene_sets, function(gene_set_idx) {
      # pos: match (within the gene set)
      # neg: non-match (outside the gene set)
      indicator_pos = gene_ranks %in% gene_set_idx
      indicator_neg = !indicator_pos

      rank_alpha  = (R_col[gene_ranks] * indicator_pos) ^ alpha

      step_cdf_pos = cumsum(rank_alpha)    / sum(rank_alpha)
      step_cdf_neg = cumsum(indicator_neg) / sum(indicator_neg)

      step_cdf_diff = step_cdf_pos - step_cdf_neg

      # Normalize by gene number
      if (scale) step_cdf_diff = step_cdf_diff / num_genes

      # Use ssGSEA or not
      if (single) {
        sum(step_cdf_diff)
      } else {
        step_cdf_diff[which.max(abs(step_cdf_diff))]
      }
    })
    unlist(es_sample)
  })

  if (length(gene_sets) == 1) es = matrix(es, nrow = 1)

  # Normalize by absolute diff between max and min
  if (norm) es = es / diff(range(es))

  # Prepare output
  rownames(es) = names(gene_sets)
  colnames(es) = colnames(X)
  return(es)
}

############# Data Loading and Processing ######
# Load gene name mapping table
# Contains: accession, protein name, gene name, MGI ID, capitalized gene name

hash.tab <- read.csv("data/0.mouse_accession_table.csv",header = TRUE)
colnames(hash.tab) <- c("accession","pro.name","gene.name","MGI","gene.name.cap")


# Load gene set definitions for pathway analysis
gene_set_table = read.csv("data/fig1.b.enrichment_pathway.csv",header = TRUE)
gene_sets = as.list(as.data.frame(gene_set_table))


####### Fig1.b ############
# Heatmap of activation levels of proteins belonging to 11 T cell signatures across 9 groups

### input: Supplemental Table S3. Protein expression matrix  sheet:4. LCMV
df <- read_excel("Supplemental Table S3. Protein expression matrix_Final.xlsx", sheet = "4. LCMV")
df <- df %>%
  mutate(`accession` = str_extract(Protein, "(?<=\\|)[^\\|]+(?=\\|)"))

df_annotated <- df %>%
  left_join(hash.tab, by = "accession") %>%
  select(accession, gene.name, gene.name.cap, everything())

df_annotated <- as.data.frame(df_annotated)  # convert tibble to data.frame
df_annotated <- df_annotated[!is.na(df_annotated[,3]), ]  # remove NA
rownames(df_annotated) <- make.unique(as.character(df_annotated[,3]))  # set rownames safely


df_annotated <- df_annotated[,-c(1:4)]
df_annotated <- df_annotated[, 1:(ncol(df_annotated) - 2)]
df_annotated = as.matrix(df_annotated)

res <- ssgsea(df_annotated, gene_sets, scale = TRUE, norm = FALSE)
mat = (res - rowMeans(res))/(rowSds(as.matrix(res)))[row(res)]


sample_names <- colnames(mat)
group_info <- case_when(
  grepl("day8_Arm_SLEC", sample_names) ~ "day8_Arm_SLEC",
  grepl("day8_Arm_MPEC", sample_names) ~ "day8_Arm_MPEC",
  grepl("day8_Cl13_Tprog", sample_names) ~ "day8_Cl13_Tprog",
  grepl("day8_Cl13_Tint", sample_names) ~ "day8_Cl13_Tint",
  grepl("day30_Arm_TCM", sample_names) ~ "day30_Arm_TCM",
  grepl("day30_Arm_TEM", sample_names) ~ "day30_Arm_TEM",
  grepl("day30_Cl13_Tprog", sample_names) ~ "day30_Cl13_Tprog",
  grepl("day30_Cl13_Tint", sample_names) ~ "day30_Cl13_Tint",
  grepl("day30_Cl13_Ttex", sample_names) ~ "day30_Cl13_Ttex",
  TRUE ~ "unknown"
)

replicate_info <- c(rep(paste0("rep", 1:4), times = 4) , rep(paste0("rep", 1:3), times = 5))

annotation_col <- data.frame(
  Group = factor(group_info, levels = c(
    "day8_Arm_SLEC", "day8_Arm_MPEC", "day8_Cl13_Tprog", "day8_Cl13_Tint", "day30_Arm_TCM",
    "day30_Arm_TEM", "day30_Cl13_Tprog", "day30_Cl13_Tint","day30_Cl13_Ttex"
  )),
  Replicate = replicate_info
)
rownames(annotation_col) <- sample_names

sorted_order <- order(annotation_col$Group, annotation_col$Replicate)
mat.sorted <- mat[, sorted_order]
annotation_col.sorted <- annotation_col[sorted_order, ]
#mat.colon.sorted <- mat.colon.sorted[1:2, ]

ann_colors <- list(
  Group = c(
    "day8_Arm_SLEC" = "#A65628",
    "day8_Arm_MPEC" = "#FC8D62",
    "day8_Cl13_Tprog" = "#8DA0CB",
    "day8_Cl13_Tint" = "#66C2A5",
    "day30_Arm_TCM" = "#E78AC3",
    "day30_Arm_TEM" = "#FFD92F",
    "day30_Cl13_Tprog" = "#B3B3B3",
    "day30_Cl13_Tint" = "#A6D854",
    "day30_Cl13_Ttex" = "#D1D854"
  )
)


df_long <- as.data.frame(na.omit(mat.sorted)) %>%
  rownames_to_column("Pathway") %>%
  pivot_longer(-Pathway, names_to = "Sample", values_to = "Score") %>%
  left_join(annotation_col %>% rownames_to_column("Sample"), by = "Sample") %>%
  mutate(
    Sample = factor(Sample, levels = colnames(mat.sorted)),             # preserve column order
    Pathway = factor(Pathway, levels = rev(rownames(mat.sorted)))       # preserve row order (reversed for heatmap)
  )

pdf('Figure/fig1.b.pdf',width = 15,height = 5.5)
ggplot(df_long, aes(x = Sample, y = Pathway, fill = Score)) +
  geom_shape(
    aes(x0 = as.numeric(Sample), y0 = as.numeric(Pathway)),
    radius = unit(0.25, "cm"),
    expand = unit(0.4, "cm"),
    corner = 0.25,
    shape = 1L
  ) +
  scale_fill_gradient2(low = "#69AADB", mid = "white", high = "#D45590", midpoint = 0) +
  coord_fixed() +
  theme_minimal(base_size = 10) +
  theme(
    axis.text.x = element_text(angle = 90, hjust = 1, vjust = 0.5),
    axis.text.y = element_text(size = 10),
    axis.title = element_blank(),
    panel.grid = element_blank()
  )
dev.off()


####### Fig1.h ############
# Process colon protein data:
# 1. Merge with gene annotations
# 2. Remove duplicates
# 3. Perform ssGSEA analysis
# 4. Generate heatmap visualization
# Load gene set definitions for pathway analysis
gene_set_w_chapron = read.csv("data/fig1.e.enrichment_pathway.csv",header = TRUE)
# Read the hash table
gene_sets = as.list(as.data.frame(gene_set_w_chapron))

pro.colon.dat <- read_excel("Supplemental Table S3. Protein expression matrix_Final.xlsx", sheet = "5. MC38.colon ")
pro.colon.dat <- pro.colon.dat %>%
  mutate(`accession` = str_extract(Protein, "(?<=\\|)[^\\|]+(?=\\|)"))

pro.colon.dat_annotated <- pro.colon.dat %>%
  left_join(hash.tab, by = "accession") %>%
  select(accession, gene.name, gene.name.cap, everything())

pro.colon.dat_annotated <- as.data.frame(pro.colon.dat_annotated)  # convert tibble to data.frame
pro.colon.dat_annotated <- pro.colon.dat_annotated[!is.na(pro.colon.dat_annotated[,2]), ]  # remove NA


#pro.colon.dat = read.table("colon.pro.txt",header = TRUE)

#pro.colon.dat <- merge(hash.tab, pro.colon.dat, by = "gene.name")
pro.colon.dat_annotated <- pro.colon.dat_annotated[!duplicated(pro.colon.dat_annotated$gene.name), ]
rownames(pro.colon.dat_annotated) <- pro.colon.dat_annotated[,2] #3
pro.colon.dat <- pro.colon.dat_annotated[,-c(1:4)]
pro.colon.dat = pro.colon.dat[, -((ncol(pro.colon.dat)-1):ncol(pro.colon.dat))]

pro.colon.dat = as.matrix(pro.colon.dat)

res.colon <- ssgsea(pro.colon.dat, gene_sets, scale = TRUE, norm = FALSE)
mat.colon = (res.colon - rowMeans(res.colon))/(rowSds(as.matrix(res.colon)))[row(res.colon)]
#mat.colon <- mat.colon[-c(1,7,8),]
mat.colon.avg <- data.frame(
  Progenitor   = rowMeans(mat.colon[, 1:3], na.rm = TRUE),
  Intermediate = rowMeans(mat.colon[, 4:6], na.rm = TRUE),
  Terminal     = rowMeans(mat.colon[, 7:9], na.rm = TRUE)
)


pro.bladder.dat <- read_excel("Supplemental Table S3. Protein expression matrix_Final.xlsx", sheet = "6. MB49.bladder")
pro.bladder.dat <- pro.bladder.dat %>%
  mutate(`accession` = str_extract(Protein, "(?<=\\|)[^\\|]+(?=\\|)"))

pro.bladder.dat_annotated <- pro.bladder.dat %>%
  left_join(hash.tab, by = "accession") %>%
  select(accession, gene.name, gene.name.cap, everything())

pro.bladder.dat_annotated <- as.data.frame(pro.bladder.dat_annotated)  # convert tibble to data.frame
pro.bladder.dat_annotated <- pro.bladder.dat_annotated[!is.na(pro.bladder.dat_annotated[,2]), ]  # remove NA


pro.bladder.dat_annotated <- pro.bladder.dat_annotated[!duplicated(pro.bladder.dat_annotated$gene.name), ]
rownames(pro.bladder.dat_annotated) <- pro.bladder.dat_annotated[,2] #3
pro.bladder.dat <- pro.bladder.dat_annotated[,-c(1:4)]
pro.bladder.dat = pro.bladder.dat[, -((ncol(pro.bladder.dat)-1):ncol(pro.bladder.dat))]

pro.bladder.dat = as.matrix(pro.bladder.dat)

res.bladder <- ssgsea(pro.bladder.dat, gene_sets, scale = TRUE, norm = FALSE)
mat.bladder = (res.bladder - rowMeans(res.bladder))/(rowSds(as.matrix(res.bladder)))[row(res.bladder)]
#mat.colon <- mat.colon[-c(1,7,8),]
mat.bladder.avg <- data.frame(
  Progenitor   = rowMeans(mat.bladder[, 1:3], na.rm = TRUE),
  Intermediate = rowMeans(mat.bladder[, 4:6], na.rm = TRUE),
  Terminal     = rowMeans(mat.bladder[, 7:9], na.rm = TRUE)
)


colon_data = mat.colon.avg
bladder_data = mat.bladder.avg
combind_data = cbind(colon_data,bladder_data)
group_info = c(rep('Colon',3) , rep('Bladder',3))

library(pheatmap)
library(RColorBrewer)
colnames(combind_data) <- c(
  "Colon_Progenitor", "Colon_Intermediate", "Colon_Terminal",
  "Bladder_Progenitor", "Bladder_Intermediate", "Bladder_Terminal"
)

# Create group annotation
annotation_col <- data.frame(Group = factor(c(rep("Colon", 3), rep("Bladder", 3))))
rownames(annotation_col) <- colnames(combind_data)

# Define custom group colors
ann_colors <- list(Group = c(Colon = "#D95F02", Bladder = "#1B9E77"))

# Custom color palette: blue-purple to pink
custom_colors <- colorRampPalette(c("#5293c9", "white", "#df81a5"))(100)
library(grid)
pdf("Figure/fig1.h.Colon_Bladder_Heatmap.pdf", width = 5, height = 4)
# Plot heatmap
pheatmap(combind_data,
         color = custom_colors,
         cluster_rows = FALSE,
         cluster_cols = FALSE,
         #show_rownames = FALSE,
         #show_colnames = FALSE,
         legend = TRUE,
         heatmap_legend_param = list(
           title = "Activation score",
           legend_height = unit(1, "cm"),  # ✅ shrink legend size
           title_gp = gpar(fontsize = 8),
           labels_gp = gpar(fontsize = 8)
         ),
         cell_fun = function(j, i, x, y, w, h, col) {
           # Draw cell fill
           grid.rect(x, y, w, h, gp = gpar(col = NA, fill = col))
           # Draw thick white border
           grid.rect(x, y, w, h, gp = gpar(col = "white", fill = NA, lwd = 1.5))
         },
         annotation_col = annotation_col,
         annotation_colors = ann_colors,
         border_color = 'white',
         gaps_col = 3,  # add space between Colon and Bladder
         cellheight = 10,
         cellwidth = 10)
dev.off()


####### Fig1.j ############
# Heatmap of activation levels of proteins belonging to 12 gene ontology terms across 8 groups
gene_set_w_chapron = read.csv("data/fig1.j.Cluster_Gene_Table.csv",header = TRUE)
# Read the hash table
gene_sets = as.list(as.data.frame(gene_set_w_chapron))


pro.colon.dat <- read_excel("Supplemental Table S3. Protein expression matrix_Final.xlsx", sheet = "5. MC38.colon ")
### for the Bladder, just set sheet as 6. MB49.bladder
pro.colon.dat <- pro.colon.dat %>%
  mutate(`accession` = str_extract(Protein, "(?<=\\|)[^\\|]+(?=\\|)"))

pro.colon.dat <- pro.colon.dat %>%
  left_join(hash.tab, by = "accession") %>%
  select(accession, gene.name, gene.name.cap, everything())
pro.colon.dat <- as.data.frame(pro.colon.dat)
pro.colon.dat <- pro.colon.dat[!is.na(pro.colon.dat[,3]), ]  # remove NA

pro.colon.dat <- pro.colon.dat[!duplicated(pro.colon.dat$gene.name.cap), ]

rownames(pro.colon.dat) <- pro.colon.dat[,3]

pro.colon.dat <- pro.colon.dat[,-c(1:4)]
pro.colon.dat = pro.colon.dat[, -((ncol(pro.colon.dat)-1):ncol(pro.colon.dat))]


pro.colon.dat = as.matrix(pro.colon.dat)

res.colon <- ssgsea(pro.colon.dat, gene_sets, scale = TRUE, norm = FALSE)
mat.colon = (res.colon - rowMeans(res.colon))/(rowSds(as.matrix(res.colon)))[row(res.colon)]


sample_names <- colnames(mat.colon)

# 构造 group 和 replicate 信息
group_info <- case_when(
  grepl("Progenitor", sample_names) ~ "Progenitor",
  grepl("Intermediate", sample_names) ~ "Intermediate",
  grepl("Terminal", sample_names) ~ "Terminal",
  TRUE ~ "unknown"
)
replicate_info <- rep(paste0("rep", 1:3), times = 3)
# 创建注释数据框
annotation_col <- data.frame(
  Group = factor(group_info, levels = c(
    "Progenitor", "Intermediate", "Terminal"
  )),
  Replicate = replicate_info
)
rownames(annotation_col) <- sample_names
ann_colors <- list(
  Group = c(
    "Progenitor" = "black",
    "Intermediate" = "#FC8D62",
    "Terminal" = "#8DA0CB"
  )
)

pdf('Figure/Fig1.j.colon_activate_score.pdf',width = 6,height = 1.9)
pheatmap(
  na.omit(mat.colon),
  annotation_col = annotation_col,
  annotation_colors = ann_colors,
  use_raster = FALSE,
  cluster_cols = FALSE,
  cluster_rows = TRUE,
  fontsize_row = 12,
  show_colnames = FALSE,
  fontsize_col = 10,
  color = colorRampPalette(c("#69AADB", "white", "#D45590"))(100),
  border_color = NA
)
dev.off()
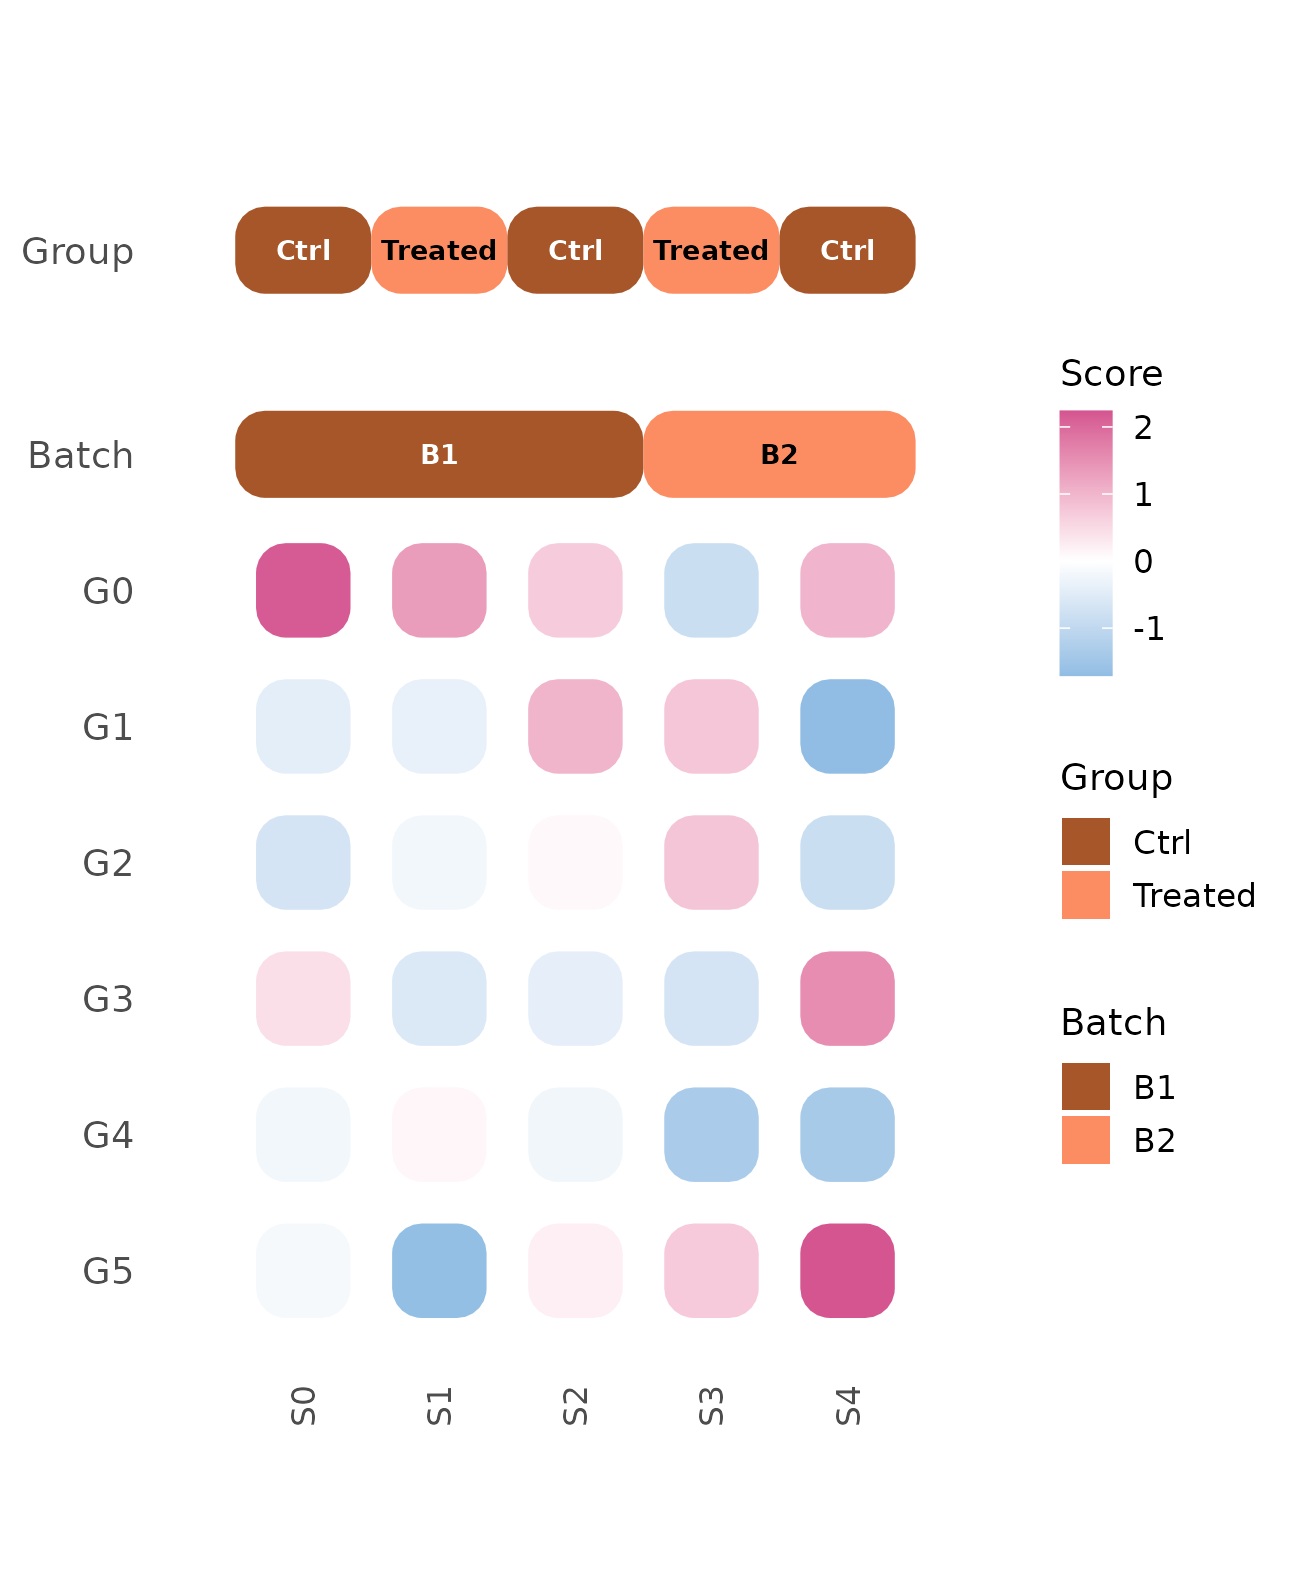
8.1_圆角热图/8.1.1_ggforce版_nature2025蛋白通路/02_圆角热图_ggforce模板.r
r · 19506 bytes
#!/usr/bin/env Rscript
# ============================================================
# 02_圆角热图_ggforce模板.R
#
# ggforce::geom_shape() 圆角热图可复用模板(ggplot2 路线)。
# 输入:第一列为行名、其余列为数值的 CSV;可选顶部注释表(单轨道或多轨道分层)。
# 输出:只输出矢量 PDF。
#
# 顶部注释两种模式:
#   --groups FILE   单轨道:sample,group[,label,color] → 一条色带 + 右侧图例
#   --tracks FILE   分层多轨道:sample,track,level[,label,color] 长表 → 多条色带,
#                   每层自动在色块上居中标注组名,轨道顺序按文件中首次出现顺序
#
# 与同目录 8.1(ComplexHeatmap 版)的分工:
#   - 8.1   走 ComplexHeatmap,适合大矩阵、需要聚类树/行注释/多图例
#   - 8.1.1 走 ggplot2 + ggforce,适合格子少、需要"Q 弹"圆角且要接 ggplot 语法栈
# 两者圆角都靠绝对单位半径(grid.roundrect / geom_shape radius),缩放不失真。
#
# ⚠ 本模板相对原版 Script.R 的关键修正(原版有 bug,详见 README「原版踩坑」):
#   1. geom_shape() 只有 expand 和 radius 两个形状参数;原版写的 corner= 和 shape=
#      是无效参数,会被 ggplot2 静默忽略(warning: Ignoring unknown parameters)。
#      圆角程度由 radius 单独控制。
#   2. 不要在 geom_shape(aes(x0=, y0=)) 里传 x0/y0 —— 那不是 geom_shape 的 aesthetic,
#      同样被忽略(warning: Ignoring unknown aesthetics)。x/y 直接用顶层 aes。
#   3. 原版把 heatmap_legend_param 传给 pheatmap(),该参数属于 ComplexHeatmap,
#      pheatmap 会经 ... 静默吞掉,什么都不做。本模板用 ggplot 原生 legend 控制。
#   4. geom_shape() 是 polygon geom:必须显式给 group=cell,否则所有格子会连成
#      一个巨大多边形。这是本模板改用数值坐标 + group=cell 的原因。
#   5. ggplot2 只允许一个 fill scale,热图(连续)与注释色带(离散)会冲突。
#      本模板用 ggnewscale::new_scale_fill() 逐层开新 fill scale。
#   6. 调色板必须 setNames() 命名后再按分组名索引;用字符索引无名向量会返回 NA。
#   7. 注释色带的 y 位置必须落在 y 轴 limits 内,否则会被静默裁掉。
# ============================================================

suppressPackageStartupMessages({
  for (pkg in c("ggplot2", "ggforce", "ggnewscale")) {
    if (!requireNamespace(pkg, quietly = TRUE)) {
      stop("缺少 ", pkg, ";请先 install.packages('", pkg, "')。")
    }
  }
})

args <- commandArgs(trailingOnly = TRUE)

arg_value <- function(key, default = NULL) {
  flag <- paste0("--", key)
  exact <- which(args == flag)
  if (length(exact) > 0L) {
    pos <- exact[1]
    if (pos == length(args)) stop(flag, " 后缺少参数值。")
    return(args[pos + 1L])
  }
  prefix <- paste0(flag, "=")
  inline <- grep(paste0("^", prefix), args, value = TRUE)
  if (length(inline) > 0L) return(sub(prefix, "", inline[1]))
  default
}

show_help <- function() {
  cat(paste0(
    "用法:Rscript 02_圆角热图_ggforce模板.R [选项]\n\n",
    "输入:\n",
    "  --input FILE       表达/评分矩阵 CSV;省略时读 示例_矩阵_演示.csv\n",
    "  --groups FILE      单轨道注释 CSV/TSV:sample,group[,label,color]\n",
    "  --tracks FILE      分层多轨道注释 CSV/TSV 长表:sample,track,level[,label,color]\n",
    "                     (--tracks 优先;轨道顺序 = 文件中 track 首次出现顺序)\n",
    "输出:\n",
    "  --out FILE         输出 PDF(默认 output/round_heatmap_ggforce.pdf)\n",
    "外观:\n",
    "  --radius_cm N      圆角半径,单位 cm(默认 0.25;0 = 直角)\n",
    "  --expand_cm N      单元格外扩半边长,单位 cm(默认 0.4;格子边长 = 该值 × 2)\n",
    "  --low COLOR        低值端颜色(默认 #69AADB)\n",
    "  --mid COLOR        中间色(默认 white)\n",
    "  --high COLOR       高值端颜色(默认 #D45590)\n",
    "  --midpoint N       中间色对应的数值(默认 0)\n",
    "  --track_label_size N  轨道组名字号(默认 6.5)\n",
    "  --width_cm N       PDF 宽度,单位 cm\n",
    "  --height_cm N      PDF 高度,单位 cm\n",
    "  --rotate_x N       x 轴标签旋转角度(默认 90)\n",
    "  --help             显示本帮助\n\n",
    "示例:\n",
    "  Rscript 02_圆角热图_ggforce模板.R --out output/demo.pdf\n",
    "  Rscript 02_圆角热图_ggforce模板.R --groups 示例_样本分组.csv --out output/one_track.pdf\n",
    "  Rscript 02_圆角热图_ggforce模板.R --tracks 示例_轨道分层.csv --out output/three_tracks.pdf\n"
  ))
}

if (any(c("--help", "-h") %in% args)) {
  show_help()
  quit(save = "no", status = 0L)
}

parse_num <- function(x, name, positive = TRUE) {
  value <- suppressWarnings(as.numeric(x))
  if (length(value) != 1L || is.na(value) || !is.finite(value)) {
    stop(name, " 必须是有限数值,当前为:", x)
  }
  if (positive && value <= 0) stop(name, " 必须是正数,当前为:", x)
  value
}

input_csv   <- arg_value("input", "示例_矩阵_演示.csv")
groups_csv  <- arg_value("groups", NA_character_)
tracks_csv  <- arg_value("tracks", NA_character_)
out_pdf     <- arg_value("out", "output/round_heatmap_ggforce.pdf")
radius_cm   <- parse_num(arg_value("radius_cm", "0.25"), "radius_cm", positive = FALSE)
expand_cm   <- parse_num(arg_value("expand_cm", "0.4"),  "expand_cm", positive = FALSE)
low_col     <- arg_value("low",  "#69AADB")
mid_col     <- arg_value("mid",  "white")
high_col    <- arg_value("high", "#D45590")
midpoint    <- parse_num(arg_value("midpoint", "0"), "midpoint", positive = FALSE)
lbl_size    <- parse_num(arg_value("track_label_size", "6.5"), "track_label_size", positive = FALSE)
rotate_x    <- parse_num(arg_value("rotate_x", "90"), "rotate_x", positive = FALSE)
width_arg   <- arg_value("width_cm", NA_character_)
height_arg  <- arg_value("height_cm", NA_character_)

if (!grepl("\\.pdf$", out_pdf, ignore.case = TRUE)) {
  stop("--out 必须以 .pdf 结尾;本仓库科研图只输出 PDF。")
}

validate_hex <- function(x, label) {
  if (!identical(x, "white") && !grepl("^#[0-9A-Fa-f]{6}$", x)) {
    stop(label, " 必须是 #RRGGBB 颜色或 \"white\",当前为:", x)
  }
}

read_table_any <- function(path, what) {
  if (!file.exists(path)) stop("找不到", what, ":", path)
  reader <- if (grepl("\\.tsv$", path, ignore.case = TRUE)) utils::read.delim else utils::read.csv
  tryCatch(reader(path, check.names = FALSE, stringsAsFactors = FALSE),
           error = function(e) stop("读取", what, "失败:", conditionMessage(e)))
}

read_matrix_csv <- function(path) {
  if (!file.exists(path)) stop("找不到输入矩阵:", path)
  raw <- tryCatch(
    utils::read.csv(path, row.names = 1, check.names = FALSE, stringsAsFactors = FALSE),
    error = function(e) stop("读取矩阵失败:", conditionMessage(e))
  )
  if (nrow(raw) < 1L || ncol(raw) < 1L) stop("矩阵至少需要 1 行和 1 列。")
  if (is.null(rownames(raw)) || anyNA(rownames(raw)) || any(trimws(rownames(raw)) == "")) {
    stop("矩阵第一列必须是非空行名。")
  }
  if (anyDuplicated(rownames(raw))) stop("矩阵行名不能重复。")
  if (anyDuplicated(colnames(raw))) stop("矩阵列名不能重复。")

  numeric_columns <- lapply(raw, function(x) suppressWarnings(as.numeric(x)))
  bad <- names(numeric_columns)[vapply(numeric_columns, function(x) anyNA(x), logical(1))]
  if (length(bad) > 0L) stop("以下列无法转为完整数值:", paste(bad, collapse = ", "))
  mat <- do.call(cbind, numeric_columns)
  dimnames(mat) <- dimnames(raw)
  if (any(!is.finite(mat))) stop("矩阵不能含 Inf 或 -Inf。")
  mat
}

# 校验注释表:sample 必须覆盖矩阵所有列(缺一不可)
# allow_dup = TRUE 用于长表(一个 sample 有多条轨道记录)
check_samples <- function(map, sample_names, what, allow_dup = FALSE) {
  map$sample <- trimws(as.character(map$sample))
  if (!allow_dup && anyDuplicated(map$sample)) stop(what, " 的 sample 不能重复。")
  absent <- setdiff(sample_names, map$sample)
  if (length(absent) > 0L) {
    stop(what, " 缺少这些矩阵列:", paste(absent, collapse = ", "))
  }
  if (allow_dup) return(map)
  map[match(sample_names, map$sample), , drop = FALSE]
}

default_palette <- c("#A65628", "#FC8D62", "#8DA0CB", "#66C2A5", "#E78AC3",
                     "#FFD92F", "#B3B3B3", "#A6D854", "#D1D854")

# 一层的颜色/标签查找表 → 命名向量(⚠ 必须命名,否则字符索引得到 NA)
level_lookup <- function(map, col, level_order, fallback) {
  vals <- vapply(level_order, function(lv) {
    v <- unique(map[[col]][map$level == lv])
    v <- v[!is.na(v) & trimws(v) != ""]
    if (length(v) > 1L) stop("同一 level 的 ", col, " 不一致:", lv)
    if (length(v) == 0L) fallback[lv] else trimws(v[1])
  }, character(1))
  stats::setNames(vals, level_order)
}

read_groups <- function(path, sample_names) {
  map <- read_table_any(path, "分组表")
  missing <- setdiff(c("sample", "group"), names(map))
  if (length(missing) > 0L) stop("分组表缺少列:", paste(missing, collapse = ", "))
  map$group <- trimws(as.character(map$group))
  map$level <- map$group
  map <- check_samples(map, sample_names, "分组表")
  validate_colors_early(map, "分组表")
  if (!"label" %in% names(map)) map$label <- map$level
  if (!"color" %in% names(map)) {
    lv <- unique(map$level)
    map$color <- unname(stats::setNames(
      default_palette[((seq_along(lv) - 1L) %% length(default_palette)) + 1L], lv)[map$level])
  }
  list(tracks = list(list(name = "Group", map = map)))
}

# 颜色格式校验:读入后立即做,避免被后续的"同一 level 颜色不一致"检查抢先报错
# (否则同一 level 给了两个非法色时,报的是"不一致"而非"格式非法",难排查)
validate_colors_early <- function(map, what) {
  if (!"color" %in% names(map)) return(invisible(NULL))
  for (i in seq_len(nrow(map))) {
    validate_hex(trimws(map$color[i]),
                 paste0(what, " 中 sample ", map$sample[i], " 的 color"))
  }
  invisible(NULL)
}

read_tracks <- function(path, sample_names) {
  map <- read_table_any(path, "轨道表")
  missing <- setdiff(c("sample", "track", "level"), names(map))
  if (length(missing) > 0L) stop("轨道表缺少列:", paste(missing, collapse = ", "))
  map$track <- trimws(as.character(map$track))
  map$level <- trimws(as.character(map$level))
  if (any(map$track == "")) stop("轨道表的 track 不能为空。")
  if (any(map$level == "")) stop("轨道表的 level 不能为空。")
  if (!"label" %in% names(map)) map$label <- map$level

  # 轨道顺序 = 文件中 track 首次出现顺序
  track_names <- unique(map$track)
  # 每个 sample 在每条轨道上必须恰好有一条记录
  counts <- table(map$sample, map$track)
  bad <- rownames(counts)[apply(counts, 1, function(r) any(r != 1))]
  if (length(bad) > 0L) {
    stop("以下 sample 在某条轨道上不是恰好一条记录:", paste(head(bad, 5), collapse = ", "))
  }
  map <- check_samples(map, sample_names, "轨道表", allow_dup = TRUE)
  validate_colors_early(map, "轨道表")

  list(tracks = lapply(track_names, function(tn) {
    sub <- map[map$track == tn, , drop = FALSE]
    # 长表按矩阵列序重排,保证色带 xi 与矩阵列一一对应
    sub <- sub[match(sample_names, sub$sample), , drop = FALSE]
    if (!"color" %in% names(sub)) {
      lv <- unique(sub$level)
      sub$color <- unname(stats::setNames(
        default_palette[((seq_along(lv) - 1L) %% length(default_palette)) + 1L], lv)[sub$level])
    }
    list(name = tn, map = sub)
  }))
}

# 把一层里连续的相同 level 归为一段:段用于画色带(每段一个多边形)并居中写组名
# 段多边形取 [start - 0.5, end + 0.5] 两个端点 —— geom_shape 的 expand 会各自向外撑开,
# 相邻段正好首尾相接,边缘平直无锯齿(逐格画会在上下边留下波浪形)。
find_runs <- function(levels_vec) {
  r <- rle(as.character(levels_vec))
  ends <- cumsum(r$lengths)
  starts <- ends - r$lengths + 1L
  data.frame(level = r$values, start = starts, end = ends,
             center = (starts + ends) / 2, n = r$lengths, stringsAsFactors = FALSE)
}

# 依背景亮度自动选黑/白文字,保证在任意配色上都可读
text_on <- function(hex) {
  rgb <- grDevices::col2rgb(hex) / 255
  lum <- 0.299 * rgb[1, ] + 0.587 * rgb[2, ] + 0.114 * rgb[3, ]
  ifelse(lum > 0.6, "black", "white")
}

# ---- 读数据 ----
mat <- read_matrix_csv(input_csv)
nr <- nrow(mat)
nc <- ncol(mat)

track_info <- if (!is.na(tracks_csv)) {
  read_tracks(tracks_csv, colnames(mat))
} else if (!is.na(groups_csv)) {
  read_groups(groups_csv, colnames(mat))
} else {
  list(tracks = list())
}
tracks <- track_info$tracks
n_tracks <- length(tracks)

cat(sprintf("矩阵:%d 行 × %d 列;顶部注释:%s\n", nr, nc,
            if (n_tracks == 0L) "无" else
              sprintf("%d 条轨道(%s)", n_tracks,
                      paste(vapply(tracks, `[[`, character(1), "name"), collapse = " / "))))

# ---- 宽矩阵 → 长表(数值坐标,geom_shape 需要 group=cell 才能逐格成形)----
# yi = nr:1 让第 1 行落在最上方;xi 按列递增。
long <- data.frame(
  xi    = rep(seq_len(nc), each = nr),
  yi    = rep(nr:1, times = nc),
  cell  = seq_len(nr * nc),
  Score = as.vector(mat),           # 列优先,与 xi/yi 的生成顺序一致
  stringsAsFactors = FALSE
)

# ---- 几何参数 ----
# geom_shape 的 expand 是「从数据点向外的半边长」,故格子实际边长 = expand_cm * 2。
# 列间距(pitch)取格边长的 1.5 倍:热图格子间留白便于分辨单个格子。
# 原版 Fig1b(38.1 × 14.0 cm 画布,11 × 31 格)反推即 格边长 0.8cm、pitch 1.2cm。
pitch_cm <- expand_cm * 2 * 1.5

# 轨道色带改用 pitch 的一半作 expand,使相邻格首尾相接拼成【连续色带】。
# ⚠ 若沿用热图的小 expand,格子间会留白,而组名文字是横跨整段的 ——
#   白字落在白色空隙上就会「缺字」(实测 SLEC 被显示成 S C,中间的 L/E 消失)。
track_expand_cm <- pitch_cm / 2

# ---- 轨道纵向排布:自下而上,最下面一条紧贴热图顶部 ----
track_pitch <- 1.5                    # 轨道间距(以格为单位)
bar_gap     <- 1.0                    # 最下一条轨道与热图顶部的间距
track_ys    <- if (n_tracks == 0L) numeric(0) else
  nr + bar_gap + (n_tracks - seq_len(n_tracks)) * track_pitch
y_top       <- if (n_tracks == 0L) nr + 0.7 else max(track_ys) + 0.7
y_bottom    <- 0.3

# ---- 主图 ----
p <- ggplot2::ggplot(long, ggplot2::aes(x = xi, y = yi, fill = Score, group = cell)) +
  # radius = 圆角半径(绝对单位,缩放不失真);expand = 半边长
  ggforce::geom_shape(
    radius = grid::unit(radius_cm, "cm"),
    expand = grid::unit(expand_cm, "cm")
  ) +
  ggplot2::scale_fill_gradient2(
    low = low_col, mid = mid_col, high = high_col, midpoint = midpoint,
    name = "Score",
    # order 越大越靠后:让 Score 图例排在所有轨道图例下方,与图面自下而上一致
    guide = ggplot2::guide_colorbar(order = 100)
  )

# ---- 逐层叠加注释轨道(每条轨道一个独立 fill scale)----
label_layers <- list()
if (n_tracks > 0L) {
  for (k in seq_len(n_tracks)) {
    tr        <- tracks[[k]]
    level_ord <- unique(tr$map$level)
    color_of  <- level_lookup(tr$map, "color", level_ord, default_palette)
    label_of  <- level_lookup(tr$map, "label", level_ord, level_ord)
    for (i in seq_along(level_ord)) {
      validate_hex(color_of[i], paste0("轨道 ", tr$name, " 的 level ", level_ord[i], " 的 color"))
    }

    # 每段一个多边形:段内所有列由同一条边覆盖,上下边缘平直无锯齿。
    # 端点取首末【格中心】,再由 expand(= pitch/2,即半格)向外撑到格的边缘 ——
    # 相邻段因此在半格处精确相接:既不留缝、也不重叠。
    runs <- find_runs(tr$map$level)
    bar <- data.frame(
      xi    = c(runs$start, runs$end),
      y     = track_ys[k],
      run   = rep(seq_len(nrow(runs)), 2),
      Level = factor(rep(runs$level, 2), levels = level_ord),
      stringsAsFactors = FALSE
    )
    p <- p +
      ggnewscale::new_scale_fill() +
      ggforce::geom_shape(
        data = bar,
        ggplot2::aes(x = xi, y = y, fill = Level, group = run),
        # ⚠ 用 track_expand_cm(= pitch/2)而非 expand_cm,让相邻段首尾相接成连续色带
        radius = grid::unit(radius_cm, "cm"),
        expand = grid::unit(track_expand_cm, "cm"),
        inherit.aes = FALSE
      ) +
      ggplot2::scale_fill_manual(name = tr$name, values = color_of, labels = label_of)

    # 组名文字:写在该段色带的正中
    label_layers[[k]] <- data.frame(
      xi    = runs$center,
      y     = track_ys[k],
      label = unname(label_of[runs$level]),
      col   = text_on(unname(color_of[runs$level])),
      stringsAsFactors = FALSE
    )
  }
}

if (length(label_layers) > 0L) {
  labels_df <- do.call(rbind, label_layers)
  p <- p + ggplot2::geom_text(
    data = labels_df,
    ggplot2::aes(x = xi, y = y, label = label),
    colour = labels_df$col, size = lbl_size / 2.845,
    fontface = "bold", inherit.aes = FALSE, show.legend = FALSE
  )
}

# ---- 坐标轴与主题 ----
y_breaks <- nr:1
y_labels <- rownames(mat)
if (n_tracks > 0L) {
  y_breaks <- c(y_breaks, track_ys)
  y_labels <- c(y_labels, vapply(tracks, `[[`, character(1), "name"))
}

p <- p +
  ggplot2::scale_x_continuous(
    breaks = seq_len(nc), labels = colnames(mat),
    expand = ggplot2::expansion(add = 0.6)
  ) +
  # ⚠ limits 必须覆盖轨道位置,否则色带被静默裁掉
  ggplot2::scale_y_continuous(
    breaks = y_breaks, labels = y_labels,
    limits = c(y_bottom, y_top),
    expand = ggplot2::expansion(add = 0)
  ) +
  ggplot2::coord_fixed(clip = "off") +
  ggplot2::theme_minimal(base_size = 10) +
  ggplot2::theme(
    axis.text.x  = ggplot2::element_text(angle = rotate_x, hjust = 1, vjust = 0.5),
    axis.text.y  = ggplot2::element_text(size = 9),
    axis.title   = ggplot2::element_blank(),
    panel.grid   = ggplot2::element_blank(),
    legend.title = ggplot2::element_text(size = 9),
    legend.text  = ggplot2::element_text(size = 8),
    legend.key.size = grid::unit(0.45, "cm")
  )

# ---- 尺寸:按矩阵规模估算(pitch_cm 已在几何参数一节算好)----
axis_cm <- 5.0                                     # 右侧图例 + 左侧行名的预留宽度
# 轨道占高:以 pitch 计(含轨道间距),再折算为 cm
bar_cm  <- if (n_tracks == 0L) 0 else n_tracks * track_pitch * pitch_cm

width_cm  <- if (is.na(width_arg))  max(10, nc * pitch_cm + axis_cm) else parse_num(width_arg, "width_cm")
height_cm <- if (is.na(height_arg)) max(5.5, nr * pitch_cm + 2.6 + bar_cm) else parse_num(height_arg, "height_cm")

dir.create(dirname(out_pdf), showWarnings = FALSE, recursive = TRUE)
ggplot2::ggsave(out_pdf, plot = p, width = width_cm, height = height_cm,
                units = "cm", device = grDevices::cairo_pdf, limitsize = FALSE)
cat(sprintf("PDF 输出:%s(%.1f × %.1f cm)\n", out_pdf, width_cm, height_cm))
cat("ROUND_HEATMAP_GGFORCE_OK\n")
8.1_圆角热图/8.1.1_ggforce版_nature2025蛋白通路/03_生成示例矩阵.r
r · 5215 bytes
#!/usr/bin/env Rscript
# ============================================================
# 03_生成示例矩阵.R
#
# 生成 8.1.1 模块的内置示例数据,使模板无需原始 xlsx 即可跑通。
# 产出三个文件(均为本地示例,会被 sync.sh 收进仓库,体积很小):
#   - 示例_矩阵_演示.csv    11 通路 × 31 样本 的 Z-score 矩阵(宽表)
#   - 示例_样本分组.csv     sample,group,label,color 四列 —— 单轨道注释(--groups)
#   - 示例_轨道分层.csv     sample,track,level,label,color 长表 —— 分层轨道注释(--tracks)
#
# 结构严格对齐原版 Fig1b:9 个组(前 4 组各 4 重复、后 5 组各 3 重复 = 31 样本)。
# 组名 day{N}_{Virus}_{Subset} 天然可拆成 Day / Virus / Subset 三层,分层轨道表即由该
# 命名规则拆出。数值为合成数据,只用于检查版式,不是任何真实测量结果。
# ============================================================
set.seed(20261016)

# ---- 9 个组及配色(原脚本 ann_colors 原值)----
group_colors <- c(
  "day8_Arm_SLEC"    = "#A65628",
  "day8_Arm_MPEC"    = "#FC8D62",
  "day8_Cl13_Tprog"  = "#8DA0CB",
  "day8_Cl13_Tint"   = "#66C2A5",
  "day30_Arm_TCM"    = "#E78AC3",
  "day30_Arm_TEM"    = "#FFD92F",
  "day30_Cl13_Tprog" = "#B3B3B3",
  "day30_Cl13_Tint"  = "#A6D854",
  "day30_Cl13_Ttex"  = "#D1D854"
)
reps <- c(rep(4L, 4), rep(3L, 5))   # → 31 样本

sample_names <- unlist(Map(
  function(g, n) paste0(g, "_rep", seq_len(n)),
  names(group_colors), reps
))
group_of <- sub("_rep[0-9]+$", "", sample_names)

# ---- 11 条通路(原版 Fig1b 图中所绘;第 12 条 Chemokine_Chemokine receptor 见 README)----
pathways <- c(
  "Naive", "Activation_Effector_function", "Exhaustion", "TCR Signaling",
  "Cytokine_Cytokine receptor", "Anergy", "NFKB_Signaling", "Stress_response",
  "MAPK_Signaling", "Adhesion", "Pro_apoptosis"
)

# ---- 合成 Z-score 矩阵:给每个组一个随机效应,使热图呈现可见的块状结构 ----
mat <- matrix(
  rnorm(length(pathways) * length(sample_names), sd = 0.55),
  nrow = length(pathways),
  dimnames = list(pathways, sample_names)
)
for (g in names(group_colors)) {
  cols <- which(group_of == g)
  mat[, cols] <- mat[, cols] + rnorm(length(pathways), sd = 1.15)
}
# 让 Stress_response 随耗竭程度递增,贴近原图叙事
mat["Stress_response", ] <- mat["Stress_response", ] +
  seq(-1, 1.4, length.out = ncol(mat))

# 行内 Z-score(与原脚本 mat = (res - rowMeans)/rowSds 一致)
mat <- t(scale(t(mat)))
# 截断极端值,避免配色被单个离群点拉偏
mat[mat >  2.5] <-  2.5
mat[mat < -2.5] <- -2.5

# ---- 1) 宽表:第一列为行名 ----
out_matrix <- data.frame(Pathway = rownames(mat), mat, check.names = FALSE)
write.csv(out_matrix, "示例_矩阵_演示.csv", row.names = FALSE, quote = FALSE)

# ---- 2) 单轨道分组表:控制列顺序 + 顶部单条色条 ----
out_groups <- data.frame(
  sample = sample_names,
  group  = group_of,
  label  = group_of,
  color  = unname(group_colors[group_of]),
  stringsAsFactors = FALSE
)
write.csv(out_groups, "示例_样本分组.csv", row.names = FALSE, quote = FALSE)

# ---- 3) 分层轨道表:把组名按 "_" 拆成 Day / Virus / Subset 三层 ----
parts <- strsplit(group_of, "_", fixed = TRUE)
if (!all(lengths(parts) == 3L)) stop("组名不全是 {day}_{virus}_{subset} 三段式,无法自动拆分。")
part_k <- function(k) vapply(parts, `[`, character(1), k)

# ⚠ 原版 ann_colors 是给「9 个组」的,同一亚群在不同 day/virus 下颜色不同
#   (Tprog 在 day8 是 #8DA0CB、在 day30 是 #B3B3B3)。拆成 Subset 轨道后一个 level
#   只能有一个颜色,故按「首次出现优先」重建 —— 既保证唯一,又尽量沿用原版配色。
subset_color <- character(0)
for (g in names(group_colors)) {
  s <- strsplit(g, "_", fixed = TRUE)[[1]][3]
  if (!s %in% names(subset_color)) subset_color[s] <- unname(group_colors[g])
}

track_defs <- list(
  list(name = "Day",    colors = c(day8 = "#7FA8C9", day30 = "#D98C6B")),
  list(name = "Virus",  colors = c(Arm  = "#7FB88A", Cl13  = "#A98BC0")),
  list(name = "Subset", colors = subset_color)
)

track_rows <- do.call(rbind, lapply(seq_along(track_defs), function(k) {
  td  <- track_defs[[k]]
  lev <- part_k(k)
  data.frame(
    sample = sample_names,
    track  = td$name,
    level  = lev,
    label  = lev,
    color  = unname(td$colors[lev]),
    stringsAsFactors = FALSE
  )
}))
write.csv(track_rows, "示例_轨道分层.csv", row.names = FALSE, quote = FALSE)

# ---- 汇总 ----
cat(sprintf("示例_矩阵_演示.csv   %d 通路 × %d 样本(范围 [%.2f, %.2f])\n",
            nrow(mat), ncol(mat), min(mat), max(mat)))
cat(sprintf("示例_样本分组.csv    %d 行(%d 个组)\n", nrow(out_groups), length(group_colors)))
cat(sprintf("示例_轨道分层.csv    %d 行(%d 条轨道:%s)\n",
            nrow(track_rows), length(track_defs),
            paste(vapply(track_defs, `[[`, character(1), "name"), collapse = " / ")))
cat("Subset 配色(首次出现优先):\n")
for (s in names(subset_color)) cat(sprintf("  %-6s %s\n", s, subset_color[s]))