01_group_flower_plot.r
r · 9670 bytes
#!/usr/bin/env Rscript
# ============================================================================
# 01_group_flower_plot.R
#
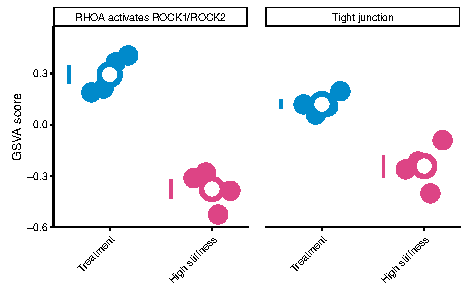
# 分组花瓣图:原始值用实心圆点组成花瓣状点簇,均值 +/- SEM 用左侧竖线
# 表示,并用白心彩色边框圆点标出均值。脚本不指定 font/family,使用
# R 默认字体;科研图只输出 PDF。
#
# 输入列:Sample, Group, Module, Score
# 默认示例:example_data.tsv
# ============================================================================

suppressPackageStartupMessages({
  if (!requireNamespace("ggplot2", quietly = TRUE)) {
    stop("缺少 ggplot2;请先运行 install.packages('ggplot2')。")
  }
  if (!requireNamespace("ggh4x", quietly = TRUE)) {
    stop("缺少 ggh4x;请先运行 install.packages('ggh4x')。")
  }
  if (!requireNamespace("dplyr", quietly = TRUE)) {
    stop("缺少 dplyr;请先运行 install.packages('dplyr')。")
  }
  library(ggplot2)
  library(ggh4x)
  library(dplyr)
})

args <- commandArgs(trailingOnly = TRUE)
script_arg <- grep("^--file=", commandArgs(), value = TRUE)
module_dir <- if (length(script_arg) > 0L) {
  dirname(normalizePath(sub("^--file=", "", script_arg[1]), mustWork = FALSE))
} else {
  getwd()
}

arg_value <- function(key, default = NULL) {
  flag <- paste0("--", key)
  exact <- which(args == flag)
  if (length(exact) > 0L) {
    pos <- exact[1]
    if (pos == length(args)) stop(flag, " 后缺少参数值。")
    return(args[pos + 1L])
  }
  inline <- grep(paste0("^", flag, "="), args, value = TRUE)
  if (length(inline) > 0L) return(sub(paste0("^", flag, "="), "", inline[1]))
  default
}

show_help <- function() {
  cat(paste0(
    "用法:Rscript 01_group_flower_plot.R [选项]\n\n",
    "选项:\n",
    "  --input FILE   输入 TSV;默认使用脚本同目录的 example_data.tsv\n",
    "  --out FILE     输出 PDF;默认 output/group_flower_plot.pdf\n",
    "  --stats FILE   Wilcoxon 统计表;默认与 PDF 同目录自动命名\n",
    "  --summary FILE 均值和 SEM 汇总表;默认与 PDF 同目录自动命名\n",
    "  --w N          PDF 宽度,单位 cm(默认 8)\n",
    "  --h N          PDF 高度,单位 cm(默认 5)\n",
    "  --help         显示本帮助\n\n",
    "示例:\n",
    "  Rscript 01_group_flower_plot.R --out output/my_flower.pdf\n",
    "  Rscript 01_group_flower_plot.R --input my_scores.tsv \\\n           --out output/my_flower.pdf\n"
  ))
}

if (any(c("--help", "-h") %in% args)) {
  show_help()
  quit(save = "no", status = 0L)
}

parse_positive <- function(x, name) {
  value <- suppressWarnings(as.numeric(x))
  if (length(value) != 1L || is.na(value) || !is.finite(value) || value <= 0) {
    stop(name, " 必须是正数,当前为:", x)
  }
  value
}

input_file <- arg_value("input", file.path(module_dir, "example_data.tsv"))
out_pdf <- arg_value(
  "out",
  file.path(module_dir, "output", "group_flower_plot.pdf")
)
if (!grepl("\\.pdf$", out_pdf, ignore.case = TRUE)) {
  stop("--out 必须以 .pdf 结尾;本仓库科研图只输出 PDF。")
}
out_stats <- arg_value(
  "stats",
  file.path(
    dirname(out_pdf),
    paste0(tools::file_path_sans_ext(basename(out_pdf)), "_stats.csv")
  )
)
out_summary <- arg_value(
  "summary",
  file.path(
    dirname(out_pdf),
    paste0(tools::file_path_sans_ext(basename(out_pdf)), "_summary.csv")
  )
)
width_cm <- parse_positive(arg_value("w", "8"), "--w")
height_cm <- parse_positive(arg_value("h", "5"), "--h")

# ---- 可复用时最常修改的配置 ----
group_levels <- c("Treatment", "High stiffness")
group_labels <- c(
  "Treatment" = "Treatment",
  "High stiffness" = "High stiffness"
)
group_cols <- c(
  "Treatment" = "#008ACB",
  "High stiffness" = "#DD4485"
)
module_levels <- c("RHO_ROCK", "TJ_KEGG")
module_labels <- c(
  "RHO_ROCK" = "RHOA activates ROCK1/ROCK2",
  "TJ_KEGG" = "Tight junction"
)
y_label <- "GSVA score"

if (!all(group_levels %in% names(group_cols))) {
  stop("group_cols 必须为每个 group 提供同名颜色。")
}
if (!all(module_levels %in% names(module_labels))) {
  stop("module_labels 必须为每个 Module 提供同名标签。")
}

required_columns <- c("Sample", "Group", "Module", "Score")
if (!file.exists(input_file)) stop("找不到输入文件:", input_file)
data <- read.delim(input_file, stringsAsFactors = FALSE, check.names = FALSE)
missing_columns <- setdiff(required_columns, names(data))
if (length(missing_columns) > 0L) {
  stop("输入文件缺少必要列:", paste(missing_columns, collapse = ", "))
}
if (!is.numeric(data$Score)) stop("Score 必须是数值列。")

unknown_groups <- setdiff(unique(na.omit(data$Group)), group_levels)
unknown_modules <- setdiff(unique(na.omit(data$Module)), module_levels)
if (length(unknown_groups) > 0L) {
  stop("Group 含未定义取值:", paste(unknown_groups, collapse = ", "))
}
if (length(unknown_modules) > 0L) {
  stop("Module 含未定义取值:", paste(unknown_modules, collapse = ", "))
}

data <- data[complete.cases(data[, required_columns]), required_columns]
if (nrow(data) == 0L) stop("去除缺失值后没有可绘图的数据。")
data$Group <- factor(data$Group, levels = group_levels)
data$Module <- factor(data$Module, levels = module_levels)

pair_counts <- table(data$Module, data$Group)
if (any(pair_counts == 0L)) {
  missing_pairs <- which(pair_counts == 0L, arr.ind = TRUE)
  labels <- apply(missing_pairs, 1L, function(i) {
    paste(rownames(pair_counts)[i[1]], colnames(pair_counts)[i[2]], sep = " / ")
  })
  stop("每个 Module 必须同时包含所有 Group,缺少:", paste(labels, collapse = ", "))
}

star_of <- function(p) {
  ifelse(p < 0.0001, "****",
  ifelse(p < 0.001, "***",
  ifelse(p < 0.01, "**",
  ifelse(p < 0.05, "*", "ns"))))
}

stat_df <- do.call(rbind, lapply(module_levels, function(module_name) {
  d <- data[data$Module == module_name, , drop = FALSE]
  test <- wilcox.test(Score ~ Group, data = d, exact = TRUE)
  data.frame(
    Module = module_name,
    n1 = sum(d$Group == group_levels[1]),
    n2 = sum(d$Group == group_levels[2]),
    statistic = unname(test$statistic),
    p = test$p.value,
    p.signif = star_of(test$p.value),
    stringsAsFactors = FALSE
  )
}))

make_petal_offsets <- function(n, spread = 0.18) {
  if (n == 1L) return(0)
  template <- c(-1, 1, -1 / 3, 1 / 3) * spread
  rep(template, length.out = n)
}

data <- data %>%
  group_by(Module, Group) %>%
  mutate(
    x_group = match(as.character(Group), group_levels),
    x_petal = x_group + make_petal_offsets(n())
  ) %>%
  ungroup()

summary_df <- data %>%
  group_by(Module, Group) %>%
  summarise(
    n = n(),
    mean_score = mean(Score),
    sem = if (n() > 1L) sd(Score) / sqrt(n()) else 0,
    .groups = "drop"
  ) %>%
  mutate(
    x_group = match(as.character(Group), group_levels),
    x_mean = x_group,
    x_error = x_group - 0.40
  )

plot <- ggplot() +
  geom_errorbar(
    data = summary_df,
    aes(
      x = x_error,
      ymin = mean_score - sem,
      ymax = mean_score + sem,
      color = Group
    ),
    width = 0,
    linewidth = 0.55,
    inherit.aes = FALSE
  ) +
  geom_point(
    data = data,
    aes(x = x_petal, y = Score, fill = Group, color = Group),
    shape = 21,
    size = 4.3,
    stroke = 0.08,
    inherit.aes = FALSE
  ) +
  geom_point(
    data = summary_df,
    aes(x = x_mean, y = mean_score, color = Group),
    shape = 21,
    fill = "white",
    size = 3.7,
    stroke = 1.5,
    inherit.aes = FALSE
  ) +
  facet_wrap2(
    ~Module,
    nrow = 1,
    labeller = labeller(Module = as_labeller(module_labels)),
    strip = strip_nested(
      background_x = elem_list_rect(fill = "transparent")
    )
  ) +
  scale_x_continuous(
    breaks = seq_along(group_levels),
    labels = unname(group_labels[group_levels]),
    limits = c(0.45, length(group_levels) + 0.35),
    expand = c(0, 0)
  ) +
  scale_fill_manual(values = group_cols, drop = FALSE) +
  scale_color_manual(values = group_cols, drop = FALSE) +
  labs(x = NULL, y = y_label) +
  scale_y_continuous(expand = expansion(mult = c(0.08, 0.18))) +
  theme_classic(base_size = 6) +
  theme(
    strip.background = element_blank(),
    strip.text = element_text(color = "black", size = 5.3, lineheight = 0.9),
    axis.text.x = element_text(
      color = "black", size = 4.7, lineheight = 0.9,
      angle = 45, hjust = 1, vjust = 1,
      margin = margin(t = 2)
    ),
    axis.text.y = element_text(size = 5.2),
    axis.title.y = element_text(size = 6),
    panel.spacing = unit(0.6, "lines"),
    legend.position = "none",
    plot.margin = margin(t = 4, r = 6, b = 4, l = 6, unit = "pt")
  )

dir.create(dirname(out_pdf), showWarnings = FALSE, recursive = TRUE)
dir.create(dirname(out_stats), showWarnings = FALSE, recursive = TRUE)
dir.create(dirname(out_summary), showWarnings = FALSE, recursive = TRUE)
ggsave(
  filename = out_pdf,
  plot = plot,
  width = width_cm,
  height = height_cm,
  units = "cm",
  device = pdf,
  bg = "white"
)

stat_export <- stat_df %>%
  mutate(Module_label = unname(module_labels[Module])) %>%
  select(Module, Module_label, n1, n2, statistic, p, p.signif)
summary_export <- summary_df %>%
  mutate(Module_label = unname(module_labels[as.character(Module)])) %>%
  select(Module, Module_label, Group, n, mean_score, sem)
write.csv(stat_export, out_stats, row.names = FALSE)
write.csv(summary_export, out_summary, row.names = FALSE)

cat("已生成:", normalizePath(out_pdf, mustWork = FALSE), "\n", sep = "")
cat("统计表:", normalizePath(out_stats, mustWork = FALSE), "\n", sep = "")
cat("汇总表:", normalizePath(out_summary, mustWork = FALSE), "\n", sep = "")
print(stat_export)