build_svg.py
python · 10334 bytes
# -*- coding: utf-8 -*-
"""
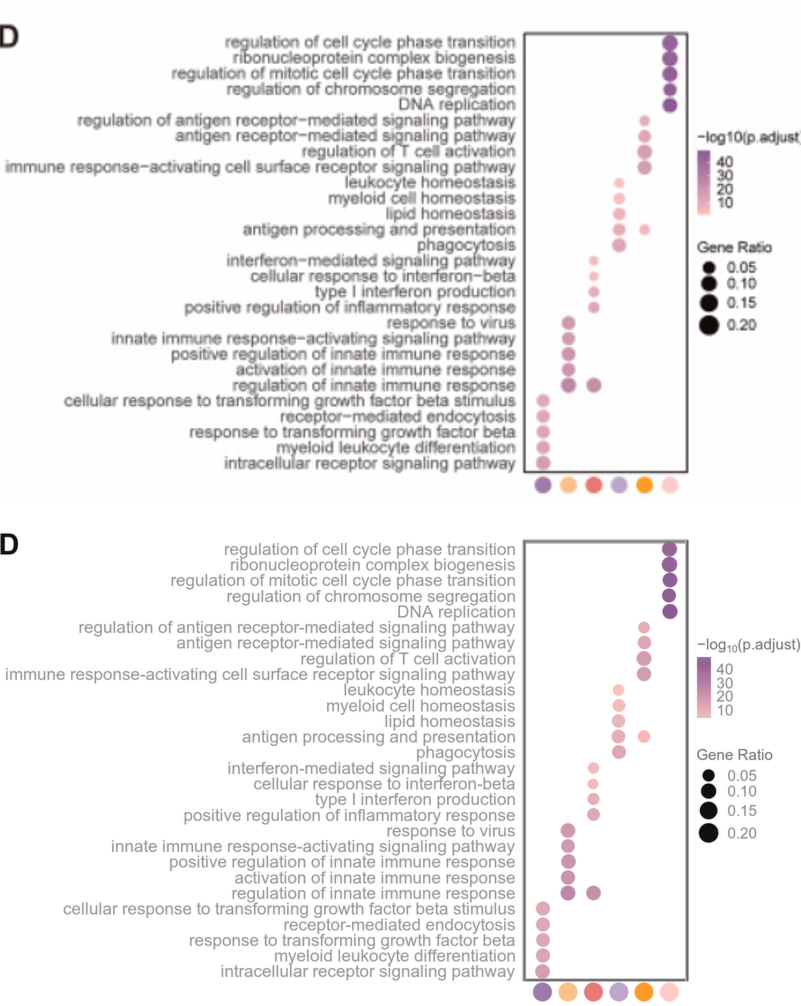
1013_亚群富集图 — 参考图像素级重建为原生 SVG
参考: 参考/image.png (801x498)
所有几何/颜色均由参考图实测提取:
- 绘图框 x=524..687 y=33..472 (H边2px, V边1px)
- 28 行标签, 行距 pitch=15.643, 行中心 top+(i+0.5)*pitch
- 6 个离散列 x=[542.7,568,593.4,618.8,644,669.5], 底部6个亚群圆点同列
- 30 个气泡: 圆心/直径(面积法)/颜色(核心12px均值) 逐行实测
- 色条 x=697..710 y=149..209 渐变逐点采样; Gene Ratio 圆 4 个实测直径
"""
from pathlib import Path
ROOT = Path(__file__).resolve().parent
OUT = ROOT / "亚群富集图.svg"
W, H = 801, 498
# ---------------- 实测数据 ----------------
TOP, BOTTOM = 33.5, 471.5
NROW = 28
PITCH = (BOTTOM - TOP) / NROW # 15.643
TEXT_RIGHT = 515.0 # 标签右对齐边界 (实测 ink 右缘 x=513, 按 advance 校准)
FONT = "Arial, Helvetica, 'Liberation Sans', sans-serif"
TEXT_FILL = "#969291" # 原图笔画主体 140-170 灰校准 (dark3%≈119, <140仅2.4%)
TEXT_SIZE = 17.0
TEXT_DY = 5.5 # 基线 = 行中心 + 5.5 (含降部 bbox 居中校准)
LABELS = [
"regulation of cell cycle phase transition",
"ribonucleoprotein complex biogenesis",
"regulation of mitotic cell cycle phase transition",
"regulation of chromosome segregation",
"DNA replication",
"regulation of antigen receptor-mediated signaling pathway",
"antigen receptor-mediated signaling pathway",
"regulation of T cell activation",
"immune response-activating cell surface receptor signaling pathway",
"leukocyte homeostasis",
"myeloid cell homeostasis",
"lipid homeostasis",
"antigen processing and presentation",
"phagocytosis",
"interferon-mediated signaling pathway",
"cellular response to interferon-beta",
"type I interferon production",
"positive regulation of inflammatory response",
"response to virus",
"innate immune response-activating signaling pathway",
"positive regulation of innate immune response",
"activation of innate immune response",
"regulation of innate immune response",
"cellular response to transforming growth factor beta stimulus",
"receptor-mediated endocytosis",
"response to transforming growth factor beta",
"myeloid leukocyte differentiation",
"intracellular receptor signaling pathway",
]
# 气泡: (row, col, cx, cy, d, fill) 面积法直径 + 核心色
BUBBLES = [
(1, 6, 669.5, 41.0, 15.10, "#966596"),
(2, 6, 669.5, 56.5, 15.47, "#966198"),
(3, 6, 670.0, 72.0, 14.84, "#8b6296"),
(4, 6, 669.0, 87.5, 14.05, "#8e6091"),
(5, 6, 670.0, 103.5, 15.10, "#8a5a93"),
(6, 5, 644.0, 119.5, 11.78, "#e3b1b7"),
(7, 5, 644.5, 134.5, 13.54, "#dea7b3"),
(8, 5, 644.0, 150.5, 14.93, "#d39eb2"),
(9, 5, 644.0, 166.0, 14.36, "#ce9eb1"),
(10, 4, 618.5, 182.0, 11.78, "#f9c2ba"),
(11, 4, 619.0, 197.5, 13.01, "#f5beba"),
(12, 4, 618.5, 213.0, 13.45, "#e9b6b9"),
(13, 4, 618.5, 228.5, 13.77, "#e6aeb7"),
(13, 5, 644.0, 228.5, 12.57, "#f8b6b8"),
(14, 4, 619.0, 244.0, 14.05, "#dea8b4"),
(15, 3, 593.5, 260.0, 11.51, "#f3babb"),
(16, 3, 593.0, 276.0, 10.82, "#f8b8ba"),
(17, 3, 593.5, 291.0, 12.10, "#e6afb8"),
(18, 3, 593.5, 306.5, 12.87, "#dda8b4"),
(19, 2, 568.0, 322.5, 14.71, "#ce9ab0"),
(20, 2, 568.0, 338.0, 13.73, "#cc9bb0"),
(21, 2, 568.5, 353.5, 14.63, "#c696ad"),
(22, 2, 568.0, 369.5, 14.32, "#c994ad"),
(23, 2, 568.0, 385.0, 14.88, "#bb8aa8"),
(23, 3, 593.5, 385.0, 14.63, "#c390a8"),
(24, 1, 543.0, 400.5, 14.23, "#e0aab2"),
(25, 1, 543.0, 416.5, 14.14, "#dea8b5"),
(26, 1, 543.0, 432.0, 13.87, "#dca7b4"),
(27, 1, 543.0, 447.5, 14.32, "#dba5b3"),
(28, 1, 542.5, 463.5, 14.63, "#d39db2"),
]
# 底部亚群圆点: (cx, cy, d, fill) — y475..493 实测, 核心纯色
GROUP_DOTS = [
(542.5, 484.0, 19.0, "#9c7bab"),
(568.0, 484.0, 19.0, "#f9c08b"),
(593.5, 484.0, 19.0, "#e57a77"),
(619.0, 484.0, 19.0, "#bda6c9"),
(644.0, 484.0, 19.0, "#fd9b2a"),
(669.5, 484.0, 19.0, "#fecdca"),
]
# 色条渐变 (x=697..710, y=149..209; 采样列 x=701..707, offset=(y-149)/60)
CB_X, CB_Y, CB_W, CB_H = 697, 149, 14, 61
CB_STOPS = [
(149, "#9971a0"), (155, "#936199"), (159, "#986695"), (163, "#a06e9c"),
(167, "#a6719f"), (171, "#ad77a0"), (175, "#b37fa4"), (179, "#ba84a8"),
(183, "#bf8aa9"), (187, "#c794ac"), (191, "#ce99af"), (195, "#d6a0b2"),
(199, "#dca6b3"), (203, "#e5afb7"), (207, "#eab6b6"), (209, "#eab6b6"),
]
# 色条刻度: (值, 数字中心y) 实测
CB_TICKS = [("40", 161.0), ("30", 175.0), ("20", 188.0), ("10", 202.0)]
# Gene Ratio 图例圆: (中心y, 直径, 标签) 面积法实测; 数字标签右对齐 x=756.5
GR_CIRCLES = [(267.4, 12.21, "0.05"), (283.1, 15.31, "0.10"),
(302.5, 17.73, "0.15"), (324.9, 19.58, "0.20")]
GR_CX = 708.6
GR_LABEL_X = 756.5
LEGEND_NUM_SIZE = 15.0 # 图例数字 (实测 "40" 宽16 / "0.05" 宽29)
LEGEND_NUM_DY = 5.5
LEGEND_FILL = "#878482" # 图例数字浅灰校准
LEGEND_TITLE_FILL = "#6f6c6b" # 图例标题核心实测 #827f7e (细笔画含AA)
# ---------------- 渲染 ----------------
def esc(s):
return (s.replace("&", "&").replace("<", "<").replace(">", ">"))
def row_center(i):
return TOP + (i + 0.5) * PITCH
def build():
p = []
a = p.append
a(f'<svg xmlns="http://www.w3.org/2000/svg" viewBox="0 0 {W} {H}" width="{W}" height="{H}">')
a('<title>亚群富集气泡图 (D) — 忠实重建自参考图</title>')
# defs: 色条渐变 (offset 必须 0..1)
a('<defs>')
a('<linearGradient id="cb-grad" x1="0" y1="149" x2="0" y2="209" gradientUnits="userSpaceOnUse">')
for y, c in CB_STOPS:
off = (y - CB_Y) / (CB_Y + CB_H - CB_Y)
a(f' <stop offset="{off:.4f}" stop-color="{c}"/>')
a('</linearGradient>')
a('</defs>')
# 面板标签 D (实测 ink y25..46 x0..17, 核心近黑)
a('<g id="panel-label">')
a(f' <text id="panel-d" x="-1.5" y="46.5" font-family="{FONT}" font-size="29" font-weight="bold" fill="#101010">D</text>')
a('</g>')
# y 轴标签 (右对齐)
a('<g id="y-labels">')
for i, s in enumerate(LABELS):
cy = row_center(i)
baseline = cy + TEXT_DY
a(f' <text id="ylabel-{i+1}" x="{TEXT_RIGHT}" y="{baseline:.2f}" text-anchor="end" '
f'font-family="{FONT}" font-size="{TEXT_SIZE}" fill="{TEXT_FILL}">{esc(s)}</text>')
a('</g>')
# 绘图框 — 按原图逐像素灰度复现 (原图为缩图: 主线+两侧 AA 扩散翼共~4px)
a('<g id="plot-frame">')
# 上边 (y31..35 实测灰度)
a(' <line x1="524" y1="31.5" x2="688" y2="31.5" stroke="#cbcbcb" stroke-width="1"/>')
a(' <line x1="524" y1="32.5" x2="688" y2="32.5" stroke="#9a9a9a" stroke-width="1"/>')
a(' <line x1="524" y1="33.5" x2="688" y2="33.5" stroke="#7e7e7e" stroke-width="1"/>')
a(' <line x1="524" y1="34.5" x2="688" y2="34.5" stroke="#959595" stroke-width="1"/>')
a(' <line x1="524" y1="35.5" x2="688" y2="35.5" stroke="#c7c7c7" stroke-width="1"/>')
# 下边 (y470..473)
a(' <line x1="524" y1="470.5" x2="688" y2="470.5" stroke="#d3d3d3" stroke-width="1"/>')
a(' <line x1="524" y1="471.5" x2="688" y2="471.5" stroke="#6b6b6b" stroke-width="1"/>')
a(' <line x1="524" y1="472.5" x2="688" y2="472.5" stroke="#5e5e5e" stroke-width="1"/>')
a(' <line x1="524" y1="473.5" x2="688" y2="473.5" stroke="#c7c7c7" stroke-width="1"/>')
# 左边 (x522..525)
a(' <line x1="522.5" y1="32" x2="522.5" y2="473" stroke="#d7d7d7" stroke-width="1"/>')
a(' <line x1="523.5" y1="32" x2="523.5" y2="473" stroke="#8f8f8f" stroke-width="1"/>')
a(' <line x1="524.5" y1="32" x2="524.5" y2="473" stroke="#5f5f5f" stroke-width="1"/>')
a(' <line x1="525.5" y1="32" x2="525.5" y2="473" stroke="#969696" stroke-width="1"/>')
# 右边 (x685..688)
a(' <line x1="685.5" y1="32" x2="685.5" y2="473" stroke="#c1c1c1" stroke-width="1"/>')
a(' <line x1="686.5" y1="32" x2="686.5" y2="473" stroke="#7f7f7f" stroke-width="1"/>')
a(' <line x1="687.5" y1="32" x2="687.5" y2="473" stroke="#5b5b5b" stroke-width="1"/>')
a(' <line x1="688.5" y1="32" x2="688.5" y2="473" stroke="#ababab" stroke-width="1"/>')
a('</g>')
# 气泡 (按行分组)
a('<g id="bubbles">')
for r in range(1, NROW + 1):
members = [b for b in BUBBLES if b[0] == r]
if not members:
continue
a(f' <g id="row-{r}">')
for (_, c, cx, cy, d, fill) in members:
a(f' <circle id="bubble-r{r}-c{c}" cx="{cx}" cy="{cy}" r="{d/2:.2f}" fill="{fill}"/>')
a(' </g>')
a('</g>')
# 底部亚群圆点
a('<g id="group-dots">')
for j, (cx, cy, d, fill) in enumerate(GROUP_DOTS, 1):
a(f' <circle id="group-dot-{j}" cx="{cx}" cy="{cy}" r="{d/2:.2f}" fill="{fill}"/>')
a('</g>')
# 图例: 颜色条
a('<g id="legend-colorbar">')
a(f' <text id="colorbar-title" x="697" y="141.5" font-family="{FONT}" font-size="15" fill="{LEGEND_TITLE_FILL}">'
f'−log<tspan font-size="10" dy="3.2">10</tspan><tspan dy="-3.2">(p.adjust)</tspan></text>')
a(f' <rect id="colorbar" x="{CB_X}" y="{CB_Y}" width="{CB_W}" height="{CB_H}" fill="url(#cb-grad)"/>')
for tick, ty in CB_TICKS:
a(f' <text class="cb-tick" x="733" y="{ty + LEGEND_NUM_DY:.1f}" text-anchor="end" '
f'font-family="{FONT}" font-size="{LEGEND_NUM_SIZE}" fill="{LEGEND_FILL}">{tick}</text>')
a('</g>')
# 图例: Gene Ratio
a('<g id="legend-gene-ratio">')
a(f' <text id="gr-title" x="696.5" y="251.8" font-family="{FONT}" font-size="15" fill="{LEGEND_TITLE_FILL}">Gene Ratio</text>')
for cy, d, lab in GR_CIRCLES:
a(f' <circle class="gr-circle" cx="{GR_CX}" cy="{cy}" r="{d/2:.2f}" fill="#101010"/>')
a(f' <text class="gr-label" x="{GR_LABEL_X}" y="{cy + LEGEND_NUM_DY:.1f}" text-anchor="end" '
f'font-family="{FONT}" font-size="{LEGEND_NUM_SIZE}" fill="{LEGEND_FILL}">{lab}</text>')
a('</g>')
a('</svg>')
return "\n".join(p)
if __name__ == "__main__":
svg = build()
OUT.write_text(svg, encoding="utf-8")
print(f"written: {OUT} ({len(svg)} bytes)")